Download
1 / 18
180 likes | 286 Views
To paraphrase Benjamin Disraeli: "There are lies, darn lies, and DAM STATISTICS." Compute the measures of central tendency for the following DAM STATISTICS. Part 3 Module 2 Measures of Central Tendency. Dam Statistics.

E N D
To paraphrase Benjamin Disraeli: "There are lies, darn lies, and DAM STATISTICS." Compute the measures of central tendency for the following DAM STATISTICS. Part 3 Module 2Measures of Central Tendency
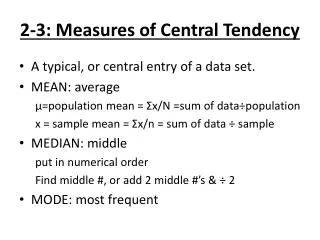
A measure ofcentral tendency is a number that represents the typical value in a collection of numbers. Three familiar measures of central tendency are the mean, the median, and the mode. We have the following collection of seven data points: 756, 726, 710, 568, 564, 440, 440 We say n = 7 for this distribution. Measures of Central Tendency
data: 756, 726, 710, 568, 564, 440, 440 In any collection of n data points, the mean is the sum of all n data points, divided by n. The Mean For the dam statistics: MEAN = (756 + 726 + 710 + 568 + 564 + 440 + 440)/7 = 4204/7 = 600.57 after rounding
In any collection of n data points, the median is "middle" data point (or average of two middle data points) when the data points are arranged in numerical order. In the case of the dam statistics, the data points are already in numerical order. 756, 726, 710, 568, 564, 440, 440 Now we choose the number in the middle of the list. 756, 726, 710, 568, 564, 440, 440 The median is 568. The Median
When calculating the median, it is important to put the data in numerical order, first. If we have an odd number of data points, then there will be one number in the middle of the ordered list. That number is the median. If we have an even number of data points, then there will be two numbers in the middle of the ordered list. The median will be the average of those two middle numbers. The Median
In any collection of numerical data points, the mode is the number that occurs most often, if there is such a number. A distribution of numerical data points will always have a mean or median, but may not have a mode. In the case of the dam statistics, the number 440 occurs more often than the other numbers, so the mode is 440. 756, 726, 710, 568, 564, 440, 440 The Mode
We would like to be able to calculate the measures of central tendency for distributions that include more than just a handful of data points. Measures of central tendency
Find the mean, median and mode for the following collection of responses to the question: "How many parking tickets have you received this semester?" 1, 1, 0,1, 2, 2, 0, 0, 0, 3, 3, 0, 3, 3, 0, 2, 2, 2, 1, 1, 4, 1, 1, 0, 3, 0, 0, 0, 1, 1, 2, 2, 2, 2, 1, 1, 1, 1, 4, 4, 4, 1, 1, 1, 1, 2, 2, 2, 2, 2, 2, 2, 2, 1, 1, 1, 1, 1, 3, 3, 0, 3, 3, 1, 1, 1, 1, 0, 0, 1, 1, 1, 1, 3, 3, 3, 2, 3, 3, 1, 1, 1, 2, 2, 2, 4, 5, 5, 4, 4, 1, 1, 1, 4, 1, 1, 1, 3, 3, 5, 3, 3, 3, 2,3, 3, 0, 0, 0, 0, 3, 3, 3, 3, 3, 3, 0, 2, 2, 2, 2, 1, 1, 1,3, 1, 0, 0, 0,1, 1, 3, 1, 1, 1, 2, 2, 2, 4, 2, 2, 2, 1, 1, 1, 1,0, 0, 2, 2, 3, 3, 2, 2, 3, 2, 0, 0, 1, 1, 3, 3, 3, 1, 1, 1, 1, 1, 2, 2, 2, 2, 1, 1, 1, 1, 0,1, 1, 1, 3, 1, 1, 1, 2, 2, 2, 1, 1, 1, 2, 1, 1, 1, 3, 3, 5, 3, 3, 1, 1, 1, 3, 3, 3, 3, 1, 1, 1, 4, 1, 1, 4, 4, 4, 4, 4, 4, 1, 1, 1, 2, 2, 5, 5, 2, 3, 3, 4, 4, 3, 2, 2, 2, 1, 5, 1,2, 2, 1, 1, 1, 2, 2, 2, 2, 2, 1, 1, 0, 1, 1, 1, 3, 3, 3, 3, 3 Example
It will be easy to work with this collection of data if we organize it first. We will arrange the data numerically. 0, 0, 0, 0, 0, 0, 0, 0, 0, 0, 0, 0, 0, 0, 0, 0, 0, 0, 0, 0, 0, 0, 0, 0, 0, 0, 0, 1, 1, 1, 1, 1, 1, 1, 1, 1, 1, 1, 1, 1, 1, 1, 1, 1, 1, 1, 1, 1, 1, 1, 1, 1, 1, 1, 1, 1, 1, 1, 1, 1, 1, 1, 1, 1, 1, 1, 1, 1, 1, 1, 1, 1, 1, 1, 1, 1, 1, 1, 1, 1, 1, 1, 1, 1, 1, 1, 1, 1, 1, 1, 1, 1, 1, 1, 1, 1, 1, 1, 1, 1, 1, 1, 1, 1, 1, 1, 1, 1, 1, 1, 1, 1, 1, 1, 1, 1, 1, 1, 1, 1, 1, 1, 1, 2, 2, 2, 2, 2, 2, 2, 2, 2, 2, 2, 2, 2, 2, 2, 2, 2, 2, 2, 2, 2, 2, 2, 2, 2, 2, 2, 2, 2, 2, 2, 2, 2, 2, 2, 2, 2, 2, 2, 2, 2, 2, 2, 2, 2, 2, 2, 2, 2, 2, 2, 2, 2, 2, 2, 2, 2, 2, 3, 3, 3, 3, 3, 3, 3, 3, 3, 3, 3, 3, 3, 3, 3, 3, 3, 3, 3, 3, 3, 3, 3, 3, 3, 3, 3, 3, 3, 3, 3, 3, 3, 3, 3, 3, 3, 3, 3, 3, 3, 3, 3, 3, 3, 3, 3, 3, 3, 3, 3, 3, 3, 3, 4, 4, 4, 4, 4, 4, 4, 4, 4, 4, 4, 4, 4, 4, 4, 4, 4, 4, 5, 5, 5, 5, 5, 5, 5 Solution
The value "0" appears 27 times. The value "1" appears 96 times. The value "2" appears 58 times. The value "3" appears 54 times. The value "4" appears 18 times. The value "5" appears 7 times. This summary provides all the information necessary to compute the mean, median and mode. Summary
The summary of data from the previous slide can be further condensed into the following frequency table. Frequency Tables
A frequency table always represents a list of numbers. The numbers from the list are shown in the “value” column. The corresponding “frequency” shows how many times a number occurs on the list. Frequency Tables
To find either the mean or the median, we need to first find n, the number of data points in the distribution. To find n, we add the frequencies. Find n from a frequency table
Summary: Mode, mean, median, from a frequency table For data in a frequency table: Mode: the value with the greatest frequency (if there is such a value). Mean = S/n where n is the sum of the frequencies, and S is the sum obtained by multiplying each frequency by its value, and adding all those terms. Median: Use (n+1)/2 to find the middle position. Count frequencies until the sum of frequencies reaches or exceeds (n+1)/2; that will show which value or values occupy the middle position(s).
Example: Read a frequency table A number of couch potatoes were asked 'How many hours of Nintendo did you play yesterday?' The responses are summarized in the table below. Value Frequency 0 14 1 27 3 17 5 18 Select the statement that is true. A. Exactly 3 couch potatoes played exactly 17 hours each. B. A total of 9 couch potatoes were surveyed. C. Exactly 41 couch potatoes played fewer than 3 hours each. D. None of these is true.
Calculate mean from frequency table A number of couch potatoes were asked 'How many hours of Nintendo did you play yesterday?' The responses are summarized in the table below. Find the mean. Value Frequency 0 14 1 27 3 17 5 18 A. 2.25 B. 2.21 C. 1.99 D. 2.39
Find median from frequency table A number of couch potatoes were asked 'How many hours of Nintendo did you play yesterday?' The responses are summarized in the table below. Find the median. Value Frequency 0 14 1 27 3 17 5 18 A. 1.00 B. 2.00 C. 3.00 D. 44.50 E. 38.50