Download
1 / 22
220 likes | 346 Views
Using unequal probability sampling to limit antici-pated variances of regression estimators. Anders Holmberg Department of Research & Development Statistics Sweden SE-701 89 Örebro Sweden Tel: +46 19 176905 Fax: +46 19 177084 E-mail: Anders.Holmberg@scb.se. Anders Holmberg ICES III 07.

E N D
Using unequal probability sampling to limit antici-pated variances of regression estimators Anders Holmberg Department of Research & Development Statistics Sweden SE-701 89 Örebro Sweden Tel: +46 19 176905 Fax: +46 19 177084 E-mail: Anders.Holmberg@scb.se Anders Holmberg ICES III 07
Outline • Background • The problem • Some theory • Auxiliary Information • An application in a business survey • Comparisons and Results • Comments Anders Holmberg ICES III 07
Background(1) • Prepare the sampling frame • Derive and analyse diagnostic data • Decide on a sampling design, sampling scheme and estimator • Launch the survey Anders Holmberg ICES III 07
Background(2) • Prerequisites • A well defined business population • Several parameters of interest • Design-based inference • An up-to-date frame from the business register • Admin. data available as auxiliary information • Attempt to find the most efficient/(robust) design Anders Holmberg ICES III 07
(t-1) (t-1) • Number of employees (u1) • Turnover (u2) • Personnel expenses (u3) • (4) Investments (u4) • Number of employees (u1) • Turnover (u2) • Personnel expenses (u3) • (4) Investments (u4) Background(6) (t-2) • Number of employees (u1) • Turnover (u2) • Personnel expenses (u3) • (4) Investments (u4) (t) • Number of employees (y1) • Turnover (y2) • Personnel expenses (y3) • (4) Investments (y4) Anders Holmberg ICES III 07
Minimum of is Optimal design in the single variable case A design that minimizes is such that Brewer, Hajek, Cassel et al., Rosén Anders Holmberg ICES III 07
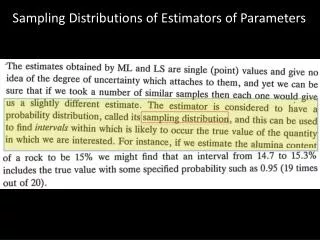
’Guesstimate’ to find size measures Population plot E.g. if : Anders Holmberg ICES III 07
(t-1) (t-1) • Number of employees (u1) • Turnover (u2) • Personnel expenses (u3) • (4) Investments (u4) • Number of employees (u1) • Turnover (u2) • Personnel expenses (u3) • (4) Investments (u4) The multivariate case? (t-2) • Number of employees (u1) • Turnover (u2) • Personnel expenses (u3) • (4) Investments (u4) (t) • Number of employees (y1) • Turnover (y2) • Personnel expenses (y3) • (4) Investments (y4) Anders Holmberg ICES III 07
The least we should do is to analyse the various designs’ possible effects on different estimators, before we make the design choice. Derive inclusion probabilities as a function of standardized (univariate) size measures Maximal Brewer selection The multivariate case Anders Holmberg ICES III 07
Minimize under the restrictions The multivariate case Try to find a design that in some sence is optimal for all important parameters? There is no evident criterion of optimality, but some are better than others. Anders Holmberg ICES III 07
The multivariate case some optimisation approaches Minimizing a weighted sum of relative efficiency losses: is minimized when Scale effects are neutralized, the relations between the ANVq :s and the corresponding single parameter minimum values (The Brewer selection) are used . Anders Holmberg ICES III 07
The multivariate case some optimisation approaches If we want to put restrictions on certain parameters, e.g. Then a design that minimizes ANOREL can be obtained through non-linear programming Optimization model: Anders Holmberg ICES III 07
The 4 variables studied for three branches (strata) SNI25: Manufacturers of food products & beverages N=749, SNI28: Manufacturers of metal goods (except machines and devices) N=2292, SNI33: Manufacturers of optical instruments N=323, An Application Analysis and comparisons made on admin data from previous reference times. Plots, Estimated correlations and gammacoefficients Anders Holmberg ICES III 07
An Application • A common ratio model pictures the relationships reasonably well if the corresponding older variable is used as regressor variable. (Strongest pairwise correlation over branches and time, although doubts exist for the investment variable) • Estimates of the gammacoefficient are sensitive. • Estimates ranged between 0.2 and 0.9 and sometimes deteriorated!? • For investments very weak or no heteroscedasticity • For the other three variables, • “cannot be ruled out” and is simple as a guesstimate Anders Holmberg ICES III 07
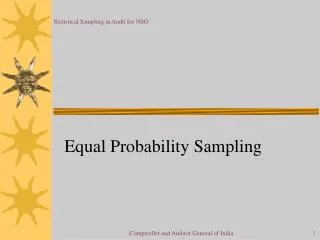
An Application Strata Anders Holmberg ICES III 07
An Application • Computations of inclusion probabilities and the anticipated variances using the Brewer selection (Maximal brewer selection) • Computation of the optimisation based approaches, with the extra condition that Anders Holmberg ICES III 07
Metal goods Maximal Brewer selection satisfies the criteria but with 25% larger sample
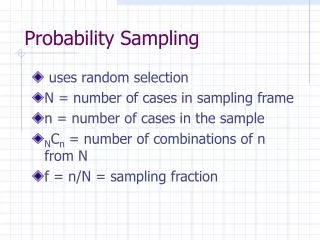
Does it work on the estimator variances? • In most cases we will never know • However, for these variables we can check against admin. data (coming in 1.5 year later) • Using • Where is the Taylor expanded variance of the ratio estimator under poisson sampling Anders Holmberg ICES III 07
Metal goods Ratios of the Taylor expanded variances to the smallest variance of each estimator (%)
Summary • Carefully choosing appropriate size measures to get limits anticipated variances of regression estimators. And Brewer’s results can be extended to a multivariate situation. • If there is a multivariate issue and you intend to use auxiliary information in the design, diagnostic computations are important. • With an optimization approach we know what we are aiming to minimize and with the non-linear programming approach some practical trouble in designing a pps-sample are avoided. Anders Holmberg ICES III 07