Download

1 / 44
480 likes | 733 Views
The Replanting of Lochaber Hydro Power Station. by Andrew Thick. Topics to be covered today. Scheme modelling; Operating capability of Lochaber; Turbine selection; Penstock works. Schematic of the Lochaber Scheme. Gravity Inflows. Surge Chamber. Gravity Inflows. Spill. Spill.

E N D
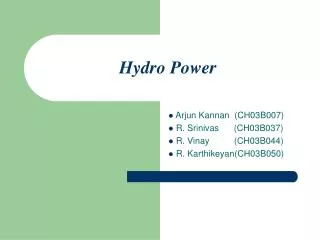
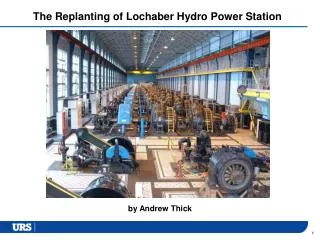
The Replanting of Lochaber Hydro Power Station by Andrew Thick
Topics to be covered today • Scheme modelling; • Operating capability of Lochaber; • Turbine selection; • Penstock works.
Schematic of the Lochaber Scheme Gravity Inflows Surge Chamber Gravity Inflows Spill Spill Spill tunnel tunnel Power-house tunnel Tailrace Penstocks Loch Laggan & reservoir Spey reservoir Loch Treig Loch Linnhe
Schematic of the Lochaber Scheme Gravity Inflows Surge Chamber Gravity Inflows Spill Spill Spill tunnel tunnel Power-house tunnel Tailrace Penstocks Loch Laggan & reservoir Spey reservoir Loch Treig Loch Linnhe
Schematic of the Lochaber Scheme Gravity Inflows Surge Chamber Gravity Inflows Spill Spill Spill tunnel tunnel Power-house tunnel Tailrace Penstocks Loch Laggan & reservoir Spey reservoir Loch Treig Loch Linnhe
Schematic of the Lochaber Scheme Gravity Inflows Surge Chamber Gravity Inflows Spill Spill Spill tunnel tunnel Power-house tunnel Tailrace Penstocks Loch Laggan & reservoir Spey reservoir Loch Treig Loch Linnhe
Schematic of the Lochaber Scheme Gravity Inflows Surge Chamber Gravity Inflows Spill Spill Spill tunnel tunnel Power-house tunnel Tailrace Penstocks Loch Laggan & reservoir Spey reservoir Loch Treig Loch Linnhe
Schematic of the Lochaber Scheme Gravity Inflows Surge Chamber Gravity Inflows Spill Spill Spill tunnel tunnel Power-house tunnel Tailrace Penstocks Loch Laggan & reservoir Spey reservoir Loch Treig Loch Linnhe
Schematic of the Lochaber Scheme Gravity Inflows Surge Chamber Gravity Inflows Spill Spill Spill tunnel tunnel Power-house tunnel Tailrace Penstocks Loch Laggan & reservoir Spey reservoir Loch Treig Loch Linnhe
Schematic of the Lochaber Scheme Gravity Inflows Surge Chamber Gravity Inflows Spill Spill Spill tunnel tunnel Power-house tunnel Tailrace Penstocks Loch Laggan & reservoir Spey reservoir Loch Treig Loch Linnhe
Schematic of the Lochaber Scheme Gravity Inflows Surge Chamber Gravity Inflows Spill Spill Spill tunnel tunnel Power-house tunnel Tailrace Penstocks Loch Laggan & reservoir Spey reservoir Loch Treig Loch Linnhe
Schematic of the Lochaber Scheme Gravity Inflows Surge Chamber Gravity Inflows Spill Spill Spill tunnel tunnel Power-house tunnel Tailrace Penstocks Loch Laggan & reservoir Spey reservoir Loch Treig Loch Linnhe
Simplified Lochaber Scheme Model Gravity Intake Flows are combined with Reservoir Inflows Qintakes Qintakes QLin QLspill QTin QTspill QLin QTunnel QLin QP/H QTin Treig Laggan
Scheme Operating Capability Diagram Average Operation 9.3 % Q 90.7 % Q No Gravity Inflows 0 % Q 100 % Q Max. Gravity Inflows 100 % Q 0 % Q
Operating Capability in terms of Loch Treig Level Note: 90.7% of water from Loch Treig9.3% of water from gravity intakes
Scheme Operating Capability Diagram Average Operation 9.3 % Q 90.7 % Q No Gravity Inflows 0 % Q 100 % Q Max. Gravity Inflows 100 % Q 0 % Q
Operating Capability in terms of Surge Shaft Water Level Note: 90.7% of water from Loch Treig9.3% of water from gravity intakes Penstock Limitation
Scheme Operating Capability Diagram Average Operation 9.3 % Q 90.7 % Q No Gravity Inflows 0 % Q 100 % Q Max. Gravity Inflows 100 % Q 0 % Q
Operating Capability in terms of Surge Shaft Water Level Note: All water from Loch Treig
Scheme Operating Capability Diagram Average Operation 9.3 % Q 90.7 % Q No Gravity Inflows 0 % Q 100 % Q Max. Gravity Inflows 100 % Q 0 % Q
Operating Capability in terms of Surge Shaft Water Level Note: All water from gravity intakes
Scheme Operating Capability Diagram Average Operation 9.3 % Q 90.7 % Q No Gravity Inflows 0 % Q 100 % Q Max. Gravity Inflows 100 % Q 0 % Q
Turbine Selection The steps towards to turbine selection were: • Analysis of historical data of scheme operation • The number of generating units was selected – 5 • Analysis of operating data from scheme model • Performance data from tendering suppliers was fed into the scheme model
Turbine Selection The steps towards to turbine selection were: • Analysis of historical data of scheme operation • The number of generating units was selected – 5 • Analysis of operating data from scheme model • Performance data from tendering suppliers was fed into the scheme model
Turbine Selection The steps towards to turbine selection were: • Analysis of historical data of scheme operation • The number of generating units was selected – 5 • Analysis of operating data from scheme model • Performance data from tendering suppliers was fed into the scheme model
Turbine Selection The steps towards to turbine selection were: • Analysis of historical data of scheme operation • The number of generating units was selected – 5 • Analysis of operating data from scheme model • Performance data from tendering suppliers was fed into the scheme model
Penstock works Key aspects of the penstock works were: • Need to undertake the works minimising shutdown of generation. • Existing penstock system was very complex. • In order to maintain double isolation, the penstocks needed to be dewatered sequentially. • The works were complex with poor access. • Decision with RTA to laser scan the penstock system and create a 3-D model.
Multiple buspipes Numerous Valves Bifurcations
Penstock works Key aspects of the penstock works were: • Need to undertake the works minimising shutdown of generation. • Existing penstock system was very complex. • In order to maintain double isolation for the penstocks needed to be dewatered sequentially. • The works were complex with poor access. • Decision with RTA to laser scan the penstock system and create a 3-D model.
Project Summary • The generating plant has been replaced to give 25+ years life extension. • The water to wire efficiency has been improved from 75% to 90+%. • Energy production increased from 460 GWh/yr to 600+ GWh/yr. • The scheme’s capability is better understood and limitations identified. • The scheme was completed ahead of schedule and is operating successfully with minimal disruption to Smelter operations during construction
Thank you for your kind attention Contact Details Andrew Thick BEng CEng MIMechE URS Infrastructure and Environment UK Limited International House, Dover Place Ashford Kent TN23 1HU United Kingdom Tel: +44 (0) 1233 658200 hydropower@urs.com