Download
1 / 32
320 likes | 329 Views
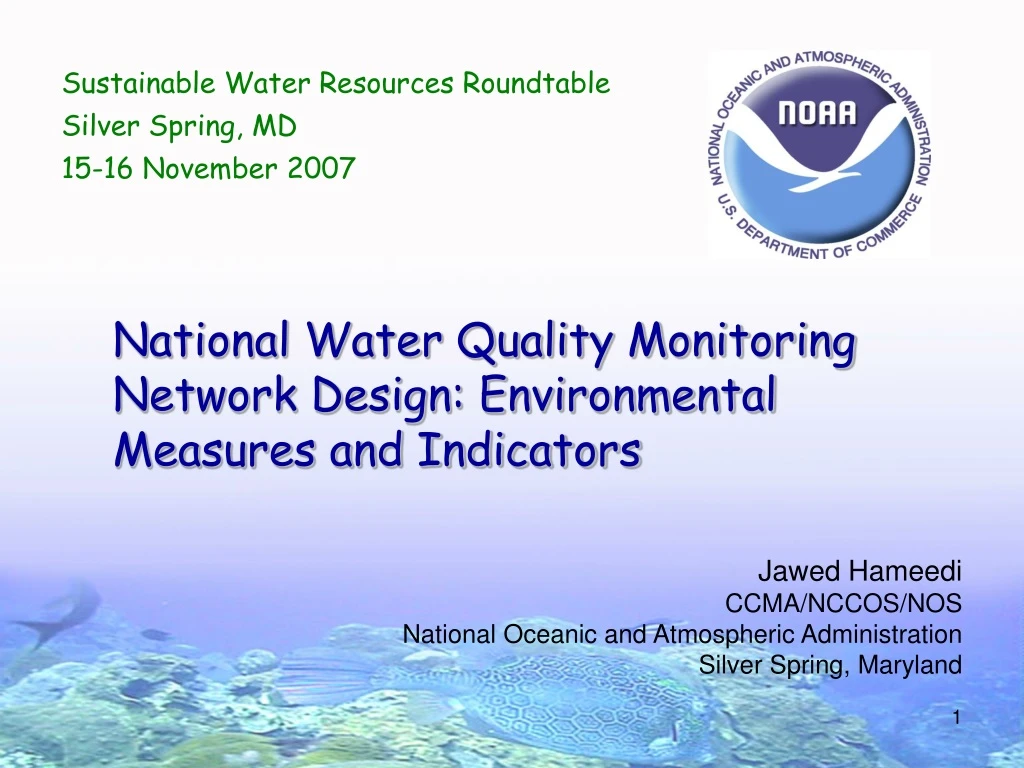
Sustainable Water Resources Roundtable Silver Spring, MD 15-16 November 2007. Jawed Hameedi CCMA/NCCOS/NOS National Oceanic and Atmospheric Administration Silver Spring, Maryland. National Water Quality Monitoring Network Design: Environmental Measures and Indicators.

E N D
Sustainable Water Resources Roundtable Silver Spring, MD 15-16 November 2007 Jawed Hameedi CCMA/NCCOS/NOS National Oceanic and Atmospheric Administration Silver Spring, Maryland National Water Quality Monitoring Network Design: Environmental Measures and Indicators
Outline of presentation • Preamble • Network Design and Chronology • Network Measures and Indicators • Biological Measures and Indicators For details on the Network design: http://acwi.gov/monitoring
I. Environmental Monitoring Issues and the Opportunity: the Network Design Large investments have produced an enormous amount of monitoring data – but the data are fragmented with poor accessibility and largely unknown quality; hence the effectiveness of data use in resource management decisions is compromised. Inadequate or non-existent accounting for contaminant input from non-point sources, the atmosphere, groundwater or the coastal watershed; source attribution of contaminants of concern is generally not known (resulting in ineffective regulations and pollution control efforts). End-of-pipe monitoring (NPDES) or habitat restoration is often not linked with ambient monitoring. Only marginal integration of data across scales; lack of a scientific framework that includes monitoring, modeling and research for understanding and forecasting water quality-related environmental issues.
Significance of the present Interagency mechanisms are in place for collaboration and integration across monitoring programs and observing systems (e.g., ICOSRMI) A system for key national environmental indicators is a high priority national need US Comptroller General – Environmental Reporting and Environmental Accounting (June 2007; September 2007) Effective mechanisms exist for involving nationwide environmental monitoring community in the design and implementation of environmental monitoring and observing systems, e.g., ACWI New observational technologies need wider applications to become both cost-effective and profitable
II. Network Focus: Eight (8) Water Quality-Related Issues • Oxygen depletion • Nutrient over-enrichment [eutrophication] • Toxic contaminants [in the environment and biota] • Sedimentation • Harmful Algal Blooms (HABs) • Habitat degradation • Invasive species • Pathogens and microbes
Ask me how – Successfully reducing nutrient input to alleviate eutrophication may be contributing to increased incidence of botulism in coastal birds, aided by expanding invasive species
Chronology: National Water Quality Monitoring Network • Ocean Action Plan (OAP) Action Item (December 2004) • Developed by the Advisory Committee on Water Information (ACWI) – request from CEQ and NSTC • NWQMN design report prepared by the NWQMC (January 2006) • Revision and formal acceptance of report by ACWI and its delivery to OSTP/CEQ (April 2006)
NWQMN Design Elements • Conceived as a “network of networks” – not something new from scratch • Multiple sampling schemes • Reconnaissance, probabilistic, targeted or directed, and short-term variability • Continuum of observations and connectivity with contaminant sources • Consistent reporting of data • Data quality and integrity; Data Management
NWQMN Design: Multiple Applications and Benefits • Comparable and quality-controlled data across regions and resource compartments • Describe status • Detect change • Provide data to determine causes and consequences of change • Environmental modeling and ecological forecasting • Integrative Information Products • Source attribution of contaminants • Identify areas for more intensive monitoring • Support Water Resources Protection and Restoration Decisions
PacificOcean Coos Bay South Slough NERR A continuum of Observations • Estuaries • Nearshore • Offshore and EEZ • Great Lakes • Coastal Beaches • Wetlands With Flow and Flux from • Rivers (HUC6) • Coastal Watersheds • Atmosphere • Groundwater
Monitoring Offshore Waters: Remote observations (shore), satellite sensors, buoys, ships and Autonomous Underwater Vehicles
Present Situation • Phased approach to implementing the Network design • Phase I: Design document (done) • Phase II. Pilot Project(s) (underway, CY 2007) • Phase III: Demonstration (new resources, CY 2008) • Phase IV: Nationwide implementation • Endorsed by Cabinet Committee on Ocean Policy; Phase II is part of the OAP Implementation Update (January 2007) • Letter from James Connaughton to ACWI (January 17, 2007) – provide advice and recommendations and work with IWG
Pilot Project(s) – Phase II • Essentially a “paper exercise” [no transfer of funds] • Pilots must preserve the integrity of the Network design • At a minimum, the pilots should offer the following: • Coastal resource management issues that would be better addressed if the Network were implemented; • Inventory of existing WQ-related monitoring and “gap analysis;” • Summary of successes and impediments to data quality control, data sharing and data dissemination; and • Estimates of costs of ongoing monitoring and cost to fill gaps. • Pilot Study Areas: Delaware Bay, Lake Michigan, and San Francisco Bay
III. Network Refinement Workgroups • Intended to identify number and specificity of variables and parameters for the Network – 100 percent case. • Biology • Nutrients • Wetlands • Atmospheric deposition • Contaminants • Etc.
IV. Biology Refinement Workgroup • Multi-agency representation • Academic institutions • Pilot project representatives • Guidance from the Interagency Working Group for the Network [USGS, EPA, NOAA, OSTP] • Ian Hartwell, Chair
Desired Criteria for Parameter Selection • They are measurable with a low margin of error, such that a “change” can be detected after a reasonable sampling effort and decision-making time-frame. • They are not costly to obtain; at least the cost should be relatable to the value of information being provided. • They are based on consensus and “expert counsel.” • They are responsive to environmental conditions (or stressors), preferably in a monotonic way; variables that respond oppositely to different stressors are probably no good.
First Challenge • Biologists’ menagerie of measurements to describe environmental status is extensive – the toolbox is overloaded! • Over 200 indicators of ecosystem status (Rice 2000) • Over 20 biomarkers just relating to NOAA’s NS&T (Hameedi, 2005) • Over 30 recommended at the National Core Coastal Indicators (2007) workshop
Second Challenge • Integrative biological measures such as biological diversity and ecosystem health • Difficult to interpret by managers and communicate to the public • What is ascendancy? Or resiliency (one of three parameters that define “ecosystem health” • What does diversity of order 2 mean to a decision-maker (or what does Hill’s N2 value of 2.42 suggest?) • What is alpha, beta or gamma diversity? • Numeric values of most indices are not comparable (derived differently – number of spp., biomass, probability, bits per species, etc.) • “Any index of diversity can be misleading” (Rice, 2003); the concept of diversity is “meaningless” (Hurlbert, 1971) • You are better off by simply describing species richness or status of biota (particular species or groups of species)
Still, we have a list of biological parameters (see handout) • The selected parameters are integrators or integrative of coastal conditions • The have wide “appeal” and appreciation • They can be measured effectively with current technologies
Tier 1 /High Priority Parameters and Variables • Dissolved oxygen levels • Chlorophyll and ocean color (reconnaissance) • Macro-algal density • Seagrass cover • Benthic habitat maps (high resolution); impervious land cover • Incidence of pathological conditions and deformities • Sediment Quality Triad
Examples of Second Tier (5) and “Special” (7) Parameters • Occurrence and severity of Harmful Algal Blooms • Status of regionally “ecologically significant” or “signature” species • Status of species considered sentinel of environmental change [birds, mammals, fish, shellfish] • Coastal Habitat Index [decadal wetland loss rate, rely on NWI] • Water Quality Index [according to NCA]
The Network will enhance database for NCAs NCCR II • Water Quality Index [dissolved oxygen chlorophyll, nitrogen, phosphorus, and water clarity] • Sediment Quality Index [sediment toxicity, sediment contaminants, and sediment organic carbon] • Benthic Index [organisms living and may include measures of community diversity, presence and absence of pollution-tolerant species] • Coastal Habitat Index [essentially based on National Wetland Inventory data] • Fish Tissue Contamination Index [based on EPA guidelines for consumption of fish / shellfish species] • An overall index NEP Condition Report EPA’s Report on the Environment
Microcystis bloom in western Lake Erie • True color Landsat 7 image (August 2003) • Additional HABs • Filamentous benthic algae (Cladophora) in Lake Michigan • Benthic cyanobacteria (Lyngbya) in Lake Erie
Fish disease and deformities Freshwater Discharge Impact Fish health Resuspension (contaminants, sediment, fungi) Osmotic stress Land-Use Activities Impact Agrochemicals Industrial chemicals Sewage and stormwater “Legacy” contaminants Habitat loss and alteration Examples Tumor (PAH-induced) Wound aggravated by fungus
Examples of fish deformities(pictures courtesy --Joan Browder, NOAA) • Fin erosion • Saddleback
Aggregated SQT values for two sampling strata in Galveston Bay. Note the relative sizes and numerical values of the two strata (550 and 21)(Hameedi, 2004; Hartwell and Hameedi, 2007)
Using acoustic technology to collect bathymetric and sediment classification data(Slides courtesy: H. Walker, US EPA) RoxAnn Seabed Classification • Single beam 200 kHz, collects info on roughness and hardness every second in depths 1-50 meters. Chirp Sub-bottom Profiler Multi-beam bathymetry system Field verification (sediment and biology)
What next in the short-term? • Pilot studies to submit draft reports to the IWG – November 2007 • IWG to draft its report to ACWI – December 2007 • ACWI Annual Meeting – February 2008 • ACWI Report and Recommendations to COP/CEQ
Thank You! Interagency Working Group for the Network Jawed.Hameedi@noaa.gov Spooner.Charles@epa.gov gmallard@usgs.gov Daniel_Walker@ostp.eop.gov tjohnson@usgs.gov