Download
1 / 8
80 likes | 254 Views
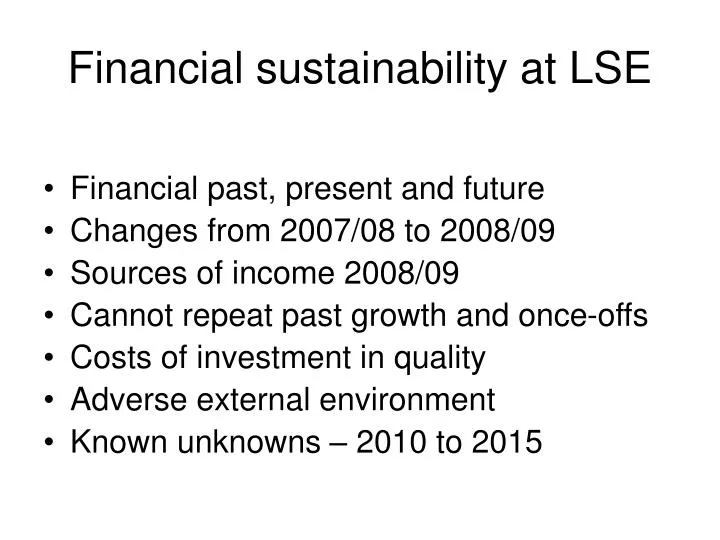
Financial sustainability at LSE. Financial past, present and future Changes from 2007/08 to 2008/09 Sources of income 2008/09 Cannot repeat past growth and once-offs Costs of investment in quality Adverse external environment Known unknowns – 2010 to 2015.

E N D
Financial sustainability at LSE • Financial past, present and future • Changes from 2007/08 to 2008/09 • Sources of income 2008/09 • Cannot repeat past growth and once-offs • Costs of investment in quality • Adverse external environment • Known unknowns – 2010 to 2015
2007/8 to 2008/9 • 2007/8 surplus £26.8m • Income • Decrease in funding council grants 0.2- • Increase in fees 5.3 • Increase in research grants 2.5 • VAT PESM reclaim 2.8 • Increase in other income 3.2 • Decrease in endowment income 1.1- £12.5m+ • Expenses • Increase in staff costs 12.6- • Increase in other expenses 7.6- • Increase in depreciation 1.5-£21.7m- • 2008/9 surplus £17.6m • Most other HEIs much lower – implementing cuts, cancelling capital projects
Sources of income (£M) – 2008/9 Income Expense Surplus • Teaching and research 150.7 150.0 0.7 • Residences and catering 26.0 26.2 0.2- • Sub total 176.7 176.2 0.5 • Ancillary programmes 22.7 14.8 7.9 • Financing/other 6.4 2.8- 9.2 • Total 205.8 188.2 17.6
Cannot repeat past growth and once-offs • GrowthAnnual • Student numbers +1650 since 2003/04 NQ • Fee scale changes NQ • Over recruitment £3.0m est • FEC implementation £2.0m est • APB income increase since 2004/05 £5.0m • Residences improvement since 2003/04 £4.0m • Once-offsAmount • VAT reclaim £2.8m • School equities divestment £0.7m • Silver Walk profit on sale £3.6m
Costs of investment in quality • Expenses2010/11 • Teaching Task Force £3.2m • LSE 100 £0.7m • Research Investment Fund/PI Fund NQ • Services Development £4.4m • Infrastructure and resilience £1.1m • Living Wage £0.6m • Interest cost of 10 year (non res) development £9.0m • Capital (10 years) • New Student Centre £36m • Research Hub/Towers £ 8m • Centre Buildings £90m • Refurbishments/Technical Infrastructure £46m • Residences £??m
Adverse external environment • HEFCE funds – RAE/QR £2.5m- • HEFCE funds – in year change £0.1m- • IBSS funding £0.1m- • Endowment income shortfall £?.?m- • Interest income £?.?m- • NI/Pension – 2009/2011 £3.0m- These are included in the forecasts
HEFCE Fees review - fees Fees review – substitution? Fees review – bursary commitments Fees review – national bursary schemes risk PGT in Price Band D review (£1.0m-) Teaching funding methodology review REF/Research funding methodology Capital funding Other Competition for students Competition for research Pensions – SAUL Endowment Income/Interest income and expense Carbon Reduction Commitment/utilities Sustainability of APB/Other Income VAT increase above 17.5%? Fundraising Unknown unknowns? Known unknowns – 2010 to 2015