Download
1 / 77
770 likes | 941 Views
HIGHLIGHTS AND INSIGHTS FROM THE EDUCAUSE 2011 CORE DATA SURVEY. Susan Grajek | October 19, 2011. WElCOME , PHILADELPHIA AND ONLINE ATTENDEES!. Who are you? Fill out CDS this year? Type of institution: Associates, BA, MA, DR, public, private, system From Canada? Other international?

E N D
HIGHLIGHTS AND INSIGHTS FROM THE EDUCAUSE 2011 CORE DATA SURVEY Susan Grajek | October 19, 2011
WElCOME, PHILADELPHIA AND ONLINE ATTENDEES! • Who are you? • Fill out CDS this year? • Type of institution: Associates, BA, MA, DR, public, private, system • From Canada? Other international? • Role: CIO, support, infosec, infrastructure, enterprise, research, teaching and learning, faculty, vendor? • CDS role: Primary representative, author, review, manager? • What color is your institution?
TOPICS COVERED TODAY • Support of research • IT in the institution • IT support • Student e-mail • Enterprise systems • Information security • Data centers • Sustainability • There’s so much more in the Core Data Survey... • The IT organization • Leadership • Governance and service level agreements • Outsourcing • Staffing and Managing the workforce • IT budgets and funding • Support for faculty use of IT in teaching and learning • Support for students
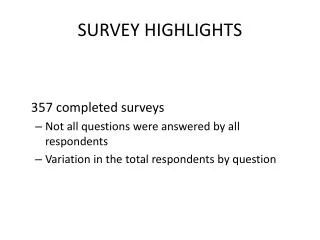
TODAY’s RESULTS ARE BASED ON Response Rates of US Institutions Initial analyses! Participation in CDS Modules
THE IT ORGANIZATION • Recently appointed • Long-serving • At private institutions • At public institutions • Report directly to the President or Chancellor • Has an academic title such as Dean • Reports to the Provost • Has been a CIO elsewhere • At community colleges • At Bachelors-level institutions • At doctoral universities • At Masters-level institutions • At international institutions • Which CIOs are most likely to have strategic impact as measured by: • Membership on the President’s or Chancellor’s cabinet • Having an institutional strategic plan that incorporates IT • Here are your options. Pick the two you think are correct:
THE IT ORGANIZATION • Recently appointed • Long-serving • At private institutions • At public institutions • Report directly to the President or Chancellor • Has an academic title such as Dean • Reports to the Provost • Has been a CIO elsewhere • At community colleges • At Bachelors-level institutions • At doctoral universities • At Masters-level institutions • At international institutions • Which CIOs are most likely to have strategic impact? • Members of the President’s or Chancellor’s cabinet • An institutional strategic plan that incorporates IT • Here are your options. Pick the two you think are correct:
ACADEMIC INVOLVEMENT IN IT GOVERNANCE • It is most common in doctoral and BA liberal arts institutions: • Doctoral: 79% with a faculty and 57% with a student advisory committee • BA liberal arts: 70% with faculty, 48% with students
WHO DELIVERS IT SERVICES TO THE INSTITUTION? But 11 services are commonly shared between IT and other units in the institution (50-25%) Other units in the institution dominate (>50%) 3 services Central IT dominates (>75% of institutions) 9 services
OUTSOURCING: MORE TALK THAN ACTION Only 2.5% of institutions’ IT staff are “all or nearly all” provided through an outsourcing arrangement Only 4% of institutions have outsourced “all or nearly all” central IT services
outsourcing ALL OR NEARLY ALL IT STAFF by institutional type Average percent of institutions outsourcing IT functions
IT OUTSOURCING/ASPs FOR SERVICES“Run partially or entirely by an external Supplier”
MANAGING THE IT WORKFORCE • 32% of institutions have a salary scale for IT professionals that is different from that of other institutional staff • 97% of thosehave either a separate set of IT job titles or a broadband IT classification and compensations system, compared to… • 53% of the institutions without a separate salary scale for IT
MANAGING THE IT WORKFORCE: STAFF DEVELOPMENT Average travel dollars per IT FTE declined from $744 to $477 Training per IT FTE decreased from $610 to $422 Travel budgets decrease for all, training dollars decline for most, but not all
CENTRAL IT FUNDING SOURCES An operating appropriation funds more than 80% of the central IT budget in all institutional types except public doctorals: • 27% of theirIT funds are from chargeback or sales of services to institutional departments, schools, and individuals
MEDIAN IT SPEND/FTE: HIGHLY VARIABLE! Canadian and other International Institutions Associates, Private Masters, Public Masters BA LA and BA General & Other Colleges Private and Public Doctorals
SUPPORT FOR FACULTY USE OF ITTeaching and Learning Services Percent of institutions offering service
Connecting the dots Deployment maturity for teaching and learning technologies MAINSTREAM • Document management tools • Hybrid courses • E-learning (wholly online courses) • Distance learning with local instructor and remote students TRANSITIONING TO MAINSTREAM • Facebook • Distance learning with local students and remote instructor • E-portfolios • Learning objects • Lecture capture • Wikis • E-books • Simulation • Intransition • Interactive learning • Collaboration tools (e.g., Google Apps, Sharepoint) • Blogs EXPERIMENTAL Content management • Mobile applications • E-textbooks • Twitter • Open content • Gaming Transitioning to Mainstream Experimental Instruction Mainstream Social media Content Innovative learning
LEARNING MANAGEMENT SYSTEMS Use of commercial LMSs is more common in all types of institutions except BA Liberal Arts colleges But faculty and students are most satisfied in institutions using a single open-source LMS
Use of Commercial vs. OPEN-Source Learning Management Systems
Student and Faculty Satisfaction with Learning Management Systems
IT SUPPORT FOR STUDENTS • Cable TV • Wireless access • Landline telephones • 64% • 72% • 78% Question: Match the service with the percent of institutions that provide it in some or all student housing rooms:
IT SUPPORT FOR STUDENTS • Landline telephones • Cable TV • Wireless access • 64% • 72% • 78% Answer: Match the service with the percent of institutions that provide it in some or all student housing rooms:
INSTITUTIONS THAT REGISTER STUDENT CELL PHONES MAKE USE OF THEM 47% of institutions require students to register their cell phone numbers 94% of those institutions offer students the option of receiving emergency communications (vs. 51%) 15% of those institutions offer students the option to access institutional information systems via text message (vs. 5%)
Institutions Charging a Student Technology Fee • Fee averages $200/year • Only 4% charge a fee that is a % of tuition, except Associates (69% of them do)
IT IN SUPPORT OF RESEARCHWHAT DOES IT COST IT TO SUPPORT RESEARCH? • For every 10% increase in the institution’s research expenditures, IT spending increases by: • 2.0% in central IT • 0.5% in distributed IT
Institutional differences in Central IT Services for Research The break in the bar represents the overall average for higher education
Institutional differences in Central IT Services for Research Institutional type averages DR MA BA LA BA other AA The break in the bar represents the overall average for higher education
Connecting the dots Maturity of IT Support for Research in Research-Intensive Institutions PERVASIVE • High Performance networking • Videoconferencing • Based on • Doctoral universities • Institutions specializing in medicine or engineering FREQUENT • Storage and hosting • Data management • Community-building • Research and Education Network access and services • High performance computing and related MODERATELY COMMON • Content-related support • Support for grants • Cyberinfrastructure services to other institutions Moderately Common Frequent Pervasive
IT IN THE INSTITUTION: BEYOND CENTRAL IT Reporting Lines for Information and Technology Functions Percent of Institutions
ACADEMIC DEPARTMENTS ARE MORE LIKELY THAN ADMINISTRATIVE TO DELIVER IT SERVICES
Percent of Non-IT Departments Providing IT Functions(Doctoral and Canadian Institutions only) Administrative departments Academic departments
Modalities of Help Desk Support The break in the bar represents the overall median for higher education
Modalities of Help Desk Support Institutional type averages DR MA BA LA BA other AA The break in the bar represents the overall median for higher education
Number of different services and APPLICATIONS supported by Help Desks Median number supported
HELP DESKS PROVIDE THE BESt SUPPORt FOR THE BASICS, BUT MOBILE DEVICES ARE NOT IGNORED