Download
1 / 18
190 likes | 217 Views
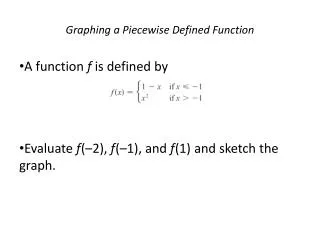
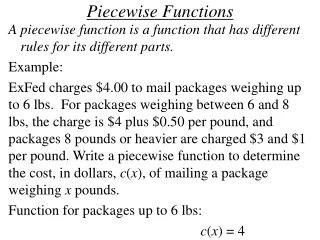
Piecewise-defined functions. Information. Piecewise-defined functions. We define a piecewise function with a minimum of two functions, each applying to a different part of the domain. For example,.

E N D
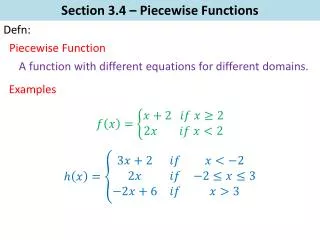
Piecewise-defined functions We define a piecewise function with a minimum of two functions, each applying to a different part of the domain. For example, What is |x| (the absolute value of x) when x is positive? How about when x is negative? The definition of |x| is different for different values of x: |x| = x if x ≥ 0 but |x| = –x if x < 0 We can define the absolute value function as a piecewise function like this: x, if x ≥ 0 f(x) = –x, if x < 0
Graphing the absolute value function The absolute value function is defined as: x, if x ≥ 0 f(x) = –x, if x < 0 y = –x for x < 0 y = x for x ≥ 0 We can graph this in its two parts: The domain for y = x is x ≥ 0. The domain for y = –x is x < 0. What is the domain of f(x)? The domain of f(x) is (–∞, ∞)
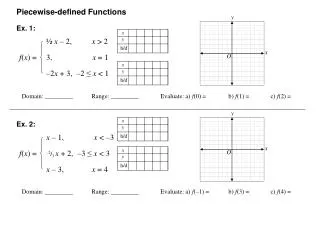
Graphing a piecewise function How would you graph this piecewise function? –x – 2, if x < –1 f(x) = 2x + 1, if x ≥ –1 Identify the first equation we need to graph and its domain: y = 2x + 1, x ≥ –1 y = –x – 2, x < –1 y = –x – 2 where x < –1 Identify the second equation we need to graph and its domain: y = 2x + 1 where x ≥ –1 Use graph paper to sketch the graph. This is an example of a “continuous” piecewise function. What do you think this means?
Circles at endpoints When graphing a piecewise function, we must examine the critical points (here, the endpoints) of each domain to see whether or not the function is defined at these points. • If the endpoint is defined, draw a closed circle. • If the endpoint is not defined, draw an open circle. A continuous function can be thought of as one that can be drawn without lifting your pencil off of the paper,i.e. it does not jump, and all rays or segments join together with no gaps. If two segments join at a point that is undefined by both domains, then there is a hole.
Write the piecewise function Write the piecewise function for the graph shown. There are two parts (or “rays”) to this piecewise function. The open circle at (0, 0) means that the domain for the left ray is x < 0.Its equation is y = ½x. The closed circle at (0, 3) means that the domain for the right ray is x ≥ 0. Its equation is –x + 3. ½x, if x < 0 The piecewise function is: f(x) = –x + 3, if x ≥ 0
Step functions A step function is piecewise function made up of horizontal components that jump up or down at certain values. We call it a step function because it resembles a set of stairs. It is made up of horizontal segments where, over specific intervals, the y-value of the function remains constant. Write the function in the graph in the form of a piecewise-defined function. 1, if –1 ≤x < 1 f(x) = 2, if 1 ≤x < 3 3, if 3 ≤ x < 5
Step function application Where can we use a step function in real life? Can you think of an instance where the cost of an item is constant over a specific interval? Below is a table containing shipping and handling fees for a catalog company. Write a step function to model this data and draw its graph on graph paper. Use your graph to find:a) f(28.50) b) f(93.89) c) f(8.99)
Step function application The function for the shipping cost, f(x), of merchandise costing $x, is: f(x) = 5.99 for 0 < x < 15.00 f(x) = 7.99 for 15.00 ≤ x < 30.00 f(x) = 8.99 for 30.00 ≤ x < 45.00 f(x) = 9.99 for 45.00 ≤ x < 60.00 f(x) = 11.99 for 60.00 ≤ x < 75.00 f(x) = 12.99 for 75.00 ≤ x < 90.00 f(x) = 14.99 for 90.00 ≤ x < 120.00 f(x) = 17.99 for x ≥ 120.00. Using your graph, the total cost including shipping for the given merchandise totals are: a) f(28.50) = $7.99, b) f(93.89) = $14.99, c) f(8.99) = £8.99.
The greatest integer function; f(x) = [x] The greatest integer function(or “floor function”)is another example of a step function. It is written as f(x) = [x]. The domain is all real numbers and the range is integers. The output value of a given input value, x, is the largest integer not greater than x. Some calculators use int(x). The graph shows f(x) = [x]. Use it to find: a) f(2.3) 2 b) f(0.7) 0 c) f(–1.3) –2 d) f(–3.7) –4 3 e) f(3.0)
Parking fees Let C(d) be the function that gives the cost to park your car in the long term parking lot at the airport for d days. The sign at the entrance says: “Parking is $100.00 for up to one week, then $20.00 for each additional day, or portion thereof.” Graph this function on graph paper.
Comparing to f(x) = [x] Use the graph to determine the cost for parking: a) 9.1 days b) 5.8 daysc) 8.7 days $100 (the minimum rate for 1 week or under) $100 + 20(3) = $160 $100 + 20(3) = $160
Comparing to f(x) = [x] Let’s compare our parking fees graph to the graph of the greatest integer function. Describe the similarities and differences between your graph and that of the greatest integer function.