Download
1 / 15
180 likes | 1.79k Views
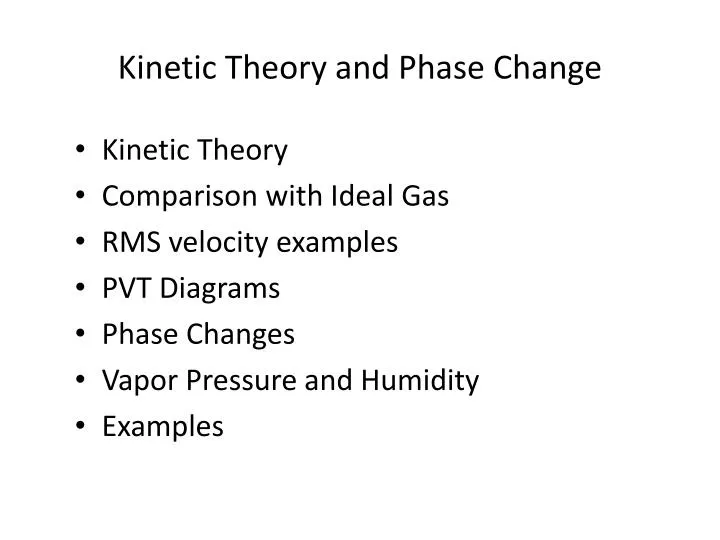
Kinetic Theory and Phase Change. Kinetic Theory Comparison with Ideal Gas RMS velocity examples PVT Diagrams Phase Changes Vapor Pressure and Humidity Examples. Ideal Gas Animation. Gas/piston animation (Java animation) (Flash animation) Note

E N D
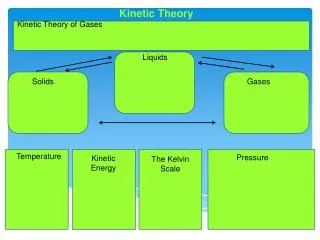
Kinetic Theory and Phase Change • Kinetic Theory • Comparison with Ideal Gas • RMS velocity examples • PVT Diagrams • Phase Changes • Vapor Pressure and Humidity • Examples
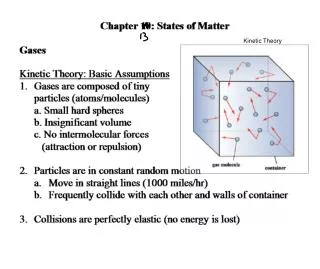
Ideal Gas Animation • Gas/piston animation (Java animation) (Flash animation) • Note • Molecule collides with wall, gives it a little Impulse. (F Δt) • No more impulse until it makes round trip, then hits again. (box size) • N molecules with average velocity • Molecules moving equally in x, y, z directions
Kinetic Theory • A little Physics 103 • Change in x-momentum for molecule hitting wall: • Time for molecule to travel 2l and hit again: • Average force during this time: • Average force of N molecules: • Average x-velocity-squared = 1/3 average total-velocity-squared • Pressure is thus: V is volume
Kinetic Theory Results - 1 • Previous page • Multiply by volume and rearrange like kinetic energy • Result • P inversely proportional to V • PV proportional to N • PV proportional to
Ideal Gas Law - #molecules version • Ideal Gas Law PV = nRT • Using #molecules: PV = NkT • N = nNA (N number of molecules) • k= R/NA (NA Avagadro’s number) • P in Pascals (no alternative units) • V in m3 • T in K° • Boltzman’s constant • k = R/NA = 1.38e-12 J/K
Kinetic Theory Results - 2 • Comparing Kinetic Theory • With Ideal Gas Law • Gives • 4. Average Kinetic Energy
Kinetic Theory Examples • Root-mean-square velocity • Example 13-16 - Average translational KE at 37°C • Example 13-17 - rmsspeed of O2 and N2 at 20°C Mass N2 RMS velocity N2
PV diagrams • Pressure vs. Volume at constant Temperature • Plot pressure vs. volume curves at constant temperature. • Different PV curves for different temperatures. (T “parameter”) • Different PV curves for different # moles. (usually constant) • Can plot in 3-D PVT diagram with 3rd temperature axis.
PV diagrams with phase change* • Pressure vs. Volume at constant Temperature. • At high temperatures PV varies normally (ideal gas). • As temperature is lowered PV becomes distorted. • As temperature is lowered further, liquid forms (critical point). • As temperature is lowered below critical point, liquid-vapor phase coexist *Non-ideal gas
3-D PVT Diagrams with Phase Change • Trace PV line at constant temperature (red) • Trace PT line at constant pressure (blue)
3-D PVT diagram projections • PV diagram is projection to the right • PT diagram is projection to the left
PT diagrams (Phase diagrams) • Pressure vs. Temperature at constant Pressure. • Below 0.006 atm water sublimes directly from solid to vapor with increasing temperature. (vapors love vacuums!) • At 0.006 atm, solid/liquid/vapor water coexists at 0.01°C (triple point). • From 0.006 to 1.0 atm, water melts above 0°C, boils below 100 °C. (Rocky Mountain pressure cooker!) • At 1.0 atm water melts at 0°C, boils at 100°C (for us folks at sea level). • From 1.0 to 218 atm, water boils between 100°C to 374°C. • Above 374°C water doesn’t exist as liquid at any pressure (critical point). Gases - Low Pressures, high temperatures Solids - High pressures, low temperatures Liquids - In between
Vapor pressure • Partial pressure of water vapor in equilibrium with liquid water. • Saturated Vapor Pressure (maximum PP) varies with temperature. • Relative Humidity
Problem 67 • What is the partial pressure of water on a day when the temperature is 25°C and the relative humidity is 40% ? • SVP from table • Relative Humidity
Problem 69 • If the humidity in a room of volume 680 m3 at 25°C is 80%, what mass of water can still evaporate from an open pan? • SVP from table • Using Ideal Gas for partial pressures • 80% of 865 moles evaporated, 20% left • Mass of 173 moles water