Download
1 / 64
640 likes | 781 Views
Building virtual cell using BioUML platform. Bios o ft.Ru. Fedor Kolpakov Biosoft.Ru, Ltd. Institute of Systems Biology, Ltd. Novosibirsk, Russia. July 6th - 11th 2013, St. Petersburg, RUSSIA. BioUML platform.

E N D
Building virtual cell using BioUML platform Biosoft.Ru Fedor Kolpakov Biosoft.Ru, Ltd. Institute of Systems Biology, Ltd.Novosibirsk, Russia July 6th - 11th 2013, St. Petersburg, RUSSIA
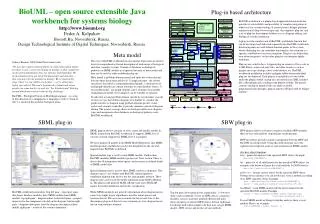
BioUML platform BioUML is an open source integrated platform for systems biology that spans the comprehensive range of capabilities including access to databases with experimental data, tools for formalized description, visual modeling and analyses of complex biological systems. Due to scripts (R, JavaScript) and workflow support it provides powerful possibilities for analyses of high-throughput data. Plug-in based architecture (Eclipse run time from IBM is used) allows to add new functionality using plug-ins. BioUML platform consists from 3 parts: BioUML server – provides access to biological databases; BioUML workbench – standalone application. BioUML web edition – web interface based on AJAX technology;
BioUMLmain features • Supports access to main biological databases: • catalolgs: Ensembl, UniProt, ChEBI, GO… • pathways: KEGG, Reactome, EHMN, BioModels, SABIO-RK, TRANSPATH, EndoNet, BMOND… • Supports main standards used in systems biology: SBML, SBGN, CellML, BioPAX, OBO, PSI-MI… • database search: • full text search using Lucene engine • graph search • graph layout engine • visual modeling: • simulation engine supports (ODE, DAE, hybrid, stochastic, 1D PDE); • composite models; • agent based modeling, rule based modelling; • parameters fitting; • genome browser (supports DAS protocol, tracks import/export); • data analyses and workflows – specialized plug-ins for microarray analysis, integration with R/Bioconductor, JavaScript support, interactive script console.
Bukharov Aleksandr, Kiselev Ilya Story 1:genome-scale model for prediction of synthesis rates of mRNAs and proteins • Initial data: • Schwanhäusser B, Busse D, Li N, Dittmar G, Schuchhardt J, Wolf J, Chen W, Selbach M. Global quantification of mammalian gene expression control. Nature, 2011,473(7347):337-342. • mouse fibroblasts, parallel metabolic pulse labelling • simultaneously measured absolute mRNA and protein abundance and turnover for 5000+ genes • first genome-scale quantitative model for prediction of synthesis rates of mRNAs and proteins
Schwanhäusser B., et al., 20011 - Fig. 6:bComparison of synthesis rates of mRNA and proteins assuming the measured levels reflect averages over one cell cycle or steady-state values. For the synthesis rates of mRNA (light gray), the deviation between the two approaches is small, because mRNA half lives are mostly smaller than the cell cycle time. For protein synthesis (dark gray), the differences are substantial; they can differ for more than one order of magnitude.
P – protein, exp – population mean, ss – steady state; Schwanhäusser B., et al., 20011 - Fig. 6:bComparison of synthesis rates of mRNA and proteins assuming the measured levels reflect averages over one cell cycle or steady-state values. For the synthesis rates of mRNA (light gray), the deviation between the two approaches is small, because mRNA half lives are mostly smaller than the cell cycle time. For protein synthesis (dark gray), the differences are substantial; they can differ for more than one order of magnitude.
“They do not take into account that gene expression in mammalian cells is non-continuous. In addition, the non-uniform age distribution of cells in culture as described in 19, 23 is neglected, since this effect is expected to be small compared to the deviation obtained by neglecting the cell cycle.“ Schwanhäusser B., et al., 20011, supplementary materials
Agent based model 4247 blocks for protein synthesis each cell is an agent
Numerical experiment. The initial size of population is 200 cells which divide within 108 hours. Average quantity of protein molecules were calculated. This experiment was repeated for 4247 proteins.
Correlation of experiment and numerical modeling is equal to R=0.99 Absolute values also were coordinated (so for 81,6% of proteins absolute values differ by less than 7% Main deviations from experimental values are observed for proteins with extremely low copy numbers, where experimental error can be significant.
Used features of BioUML platform • tables support (import, calculated columns); • JavaScript API for model generation (from tabular data) • visual modeling – diagram visualization • agent based modeling • ODE solver
- tabIe with initial data (Schwannhauser B.et al., 2011);- calculated columns (k degradation)
Story 2: the modular model of apoptosis • 13 modules • 279 species • 372 reactions • 459 parameters Kutumova E.O. et. al.,Advances in Experimental Medicine and Biology, 2012, 736(2):235-245
Modules: clear specification of interfaces input/output contacts
Mitochondron module(BMOND ID: Int_Mitoch_module) Bagci EZ, et al, Biophysical J 2006 Albeck JG, et al, PLoS Biol 2008 • Additions: • Activation of CREB and deactivation of BAD by Akt-PP and ERK-PP • Upregulation of Bcl-2 by CREB • Bcl-2 suppression by p53
EGF module(BMOND ID: Int_EGF_module) Schoeberl B, et al: Nature Biotechnology 2002 Borisov N, et al: Molecular Systems Biology 2009 • Additions: • Reactions of protein syntheses and degradations
Modular model allows us to combine both up-down and bottom-up approaches top-down bottom-up
Extreme programming (XP) methodology • Planning • User stories • Make frequent small releases • The project is divided into iterations • Coding • Code must be written to agreed standards • Unit test first • Integrate often • Collective ownership • Testing • Unit/acceptance tests
XP adaptation to modeling • Planning • User stories: requirements for the model based on the experimental data • Make frequent small releases • Iterations: after each iteration a new set of experimental data should be reproduced • Coding • Standards: SBGN, SBML, modular extension • Unit test first • Integrate often: model is saved into public database • Collective ownership: collaborative editing and chat • Testing • Unit/acceptance tests: BioUML provides the facilities for testing the models.
User stories: requirements for the model Iteration 1 Iteration 2 Iteration 3 No external signals concentration of the cleaved PARP is zero. CD95L signaling dynamics of pro-8 and casp-8 according to Bentele et. al. TNF-a signaling dynamics of pro-8 and casp-8 according to Janes et. al.
Types of the acceptance tests • Steady-state • Time course • Control of the variable values
Iterations and acceptance tests Iteration 1 Iteration 2 Iteration 3
Modeling of the execution phase of apoptosis Bentele et. al., 2004
Iteration 1: execution phase Steady-state acceptance test
Iteration 2: CD95-signaling Experiment time courses for pro-8 and casp-8 according to the data by Bentele, et. al., 2004
Used features of BioUML platform • visual modeling (SBGN notation) • modular modelling • parameters fitting • acceptance tests • ODE solver
Parameters fitting - main features Experimental data – time courses or steady states expressed as exact or relative values of substance concentrations Different optimization methods for analysis Multi-experimentsfitting Constraint optimization Local/global parameters Parameters optimization using java script
CD95L moduleand results of fitting its dynamics to experimental data Bentele M, 2004 Neumann L, 2010
Ivan Yevshin, Dmitry Levanov, Yuriy Kondrakhin Story 3Predicting transcription level from ChIP-seq data
GTRD - Gene Transcription Regulation Database Initial row data,collected from literature, GEO, SRA and ENCODE databases weresystematically collected and uniformly processed using speciallydeveloped workflow (pipeline) for BioUML platform:- sequenced reads were aligned to reference genome using Bowtie;- peaks were identified using MACS and SISSR algorithms- further refinement of obtained peaks- position weight matrices (PWM) were constructed by different methods(ChIPMunk, our own methods)- ROC curves were calculated to estimate and compare built PWM- site models (PWMs + thresholds) were constucted for recognition TFbinding sites.TFClass database is used as a core for information about transcriptionfactors, their classification and cross-linking with Ensembl.BioUML platformprovides web interface for access to GTRD database:search information, browsing, different data views. Built-in genomebrowser provides powerful visualisation of ChIP-seq data.
Prediction of gene expression level by ChIP-seq data ChIP-seq peaks (MACS) for histones and transcriptio factor binding sites were extracted from GTRD database for 2 cell lines: GM12878 and K562. Machine learning - Random Forest algorithm. R - 0.72 – 0.77
Used features of BioUML platform • integration with Galaxy to use 3-rd party command line tools (Bowtie, SISSR) • integration with Rfor statistic analyses and plot visulisations • build-in analyses methodsNGS data control • workflowsfor automated NGS data processing • genome browserfor ChIP-seq peaks visualisation • web interface for GTRD • search possibilities • tree views • tables
Genome browser Two BAM tracks are compared with each other (Example view on Human NCBI37 Chr.1) Profile is visible showing the coverage
Genome browser Upon zooming individual reads become visible. All information associated with selected read is displayed in the Info box
Genome browser In detailed scale phred qualities graph is displayed along with changed nucleotides between read and reference sequence
Nikita Mandrik, Tagir Valeev Story 4Glicomics – rule based modeling Rule-based modeling involves the representation of molecules as structured objects and molecular interactions as rules for transforming the attributes of these objects. Data and approach: Bennun SV, Yarema KJ, Betenbaugh MJ, Krambeck FJ.Integration of the transcriptome and glycome for identification of glycan cell signatures. PLoS Comput Biol. 2013;9(1):e1002813. doi: 10.1371/journal.pcbi.1002813. BioNetGen – language and approach for rule based modeling http://bionetgen.org