Download
1 / 30
300 likes | 397 Views
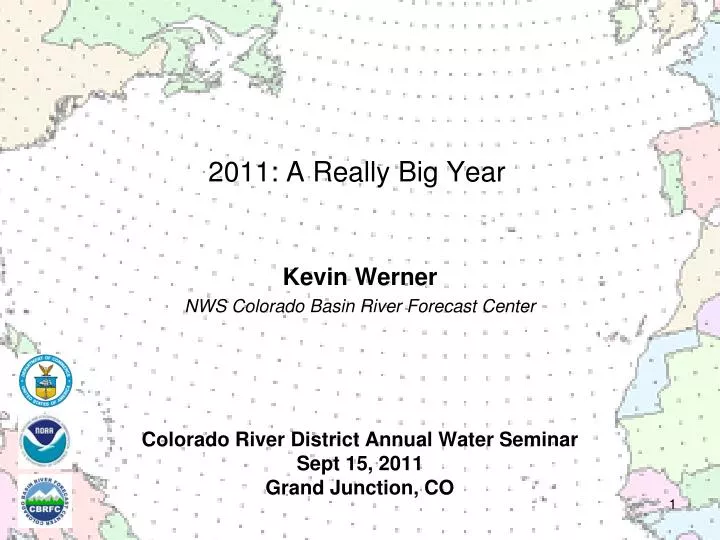
2011: A Really Big Year. Colorado River District Annual Water Seminar Sept 15, 2011 Grand Junction, CO. Kevin Werner NWS Colorado Basin River Forecast Center. Outline. River Forecast Center overview 2011 runoff review Forecast verification 30 year average update.

E N D
2011: A Really Big Year Colorado River District Annual Water SeminarSept 15, 2011Grand Junction, CO Kevin Werner NWS Colorado Basin River Forecast Center
Outline • River Forecast Center overview • 2011 runoff review • Forecast verification • 30 year average update
Colorado BasinRiver Forecast Center • The Colorado Basin River Forecast Center (CBRFC) generates streamflow forecasts across the Colorado and Utah. The latest forecasts, data, and more are available online: • Daily streamflow forecasts • Long lead peak flow forecasts • Water supply forecasts • Webinar briefings • Email updates • And More…. www.cbrfc.noaa.gov
Early 2011 • Pre Holiday Storm: • Lake Mead up ~2 feet from local runoff • Large snow accumulation • Forecasts reflected that…. Irrational Exuberance?
4090/129% 1040/85% Web Reference: www.cbrfc.noaa.gov/gmap/gmapm.php?wcon=checked
Spring 2011 • Winter and Spring 2011 were much wetter than normal for most of Utah – especially the months of March/April/May • Spring was very cold across Utah • Snowpack accumulated to record or near record amounts at most SNOTEL sites • Snow melt was delayed – and largely tempered by cool May/June weather • Flood did occur in low elevation basins (May/June) and high elevation basins (late June/July)
Spring 2011 • Winter and Spring 2011 were much wetter than normal for most of Utah – especially the months of March/April/May • Spring was very cold across Utah • Snowpack accumulated to record or near record amounts at most SNOTEL sites • Snow melt was delayed – and largely tempered by cool May/June weather • Flood did occur in low elevation basins (May/June) and high elevation basins (late June/July)
Spring 2011 • Winter and Spring 2011 were much wetter than normal for most of Utah – especially the months of March/April/May • Spring was very cold across Utah • Snowpack accumulated to record or near record amounts at most SNOTEL sites • Snow melt was delayed – and largely tempered by cool May/June weather • Flood did occur in low elevation basins (May/June) and high elevation basins (late June/July)
Spring 2011 2011 Inflow = 12.9 MAF 163% of normal • Winter and Spring 2011 were much wetter than normal for most of Utah – especially the months of March/April/May • Spring was very cold across Utah • Snowpack accumulated to record or near record amounts at most SNOTEL sites • Snow melt was delayed – and largely tempered by cool May/June weather • Flood did occur in low elevation basins (May/June) and high elevation basins (late June/July)
Flooding and High Flows • Wettest area was northern Colorado • Upper Colorado also quite wet • Gunnison divided web from normal • Dolores, San Juan basins nearer normal
Peak Flow Forecasts Daily Forecasts • Full Hydrograph out 14 days • Includes temperature (10 days) and precipitation (5 days) forecast • Includes any knowledge of future regulation (e.g. reservoir release) • Single value forecast • Issued daily by 10am MDT and updated throughout day • ~450 forecast points Long Lead Peak Flow Forecasts • Snowmelt maximum mean daily flow (April-July) • Probabilistic Forecasts Exceedence Probabilities -10%,25%,50%, 75%, 90% • Issued (at least) monthly from March-June (this year weekly starting April 19) • ~60 forecast points – some unregulated, some regulated
Yampa: Daily Forecasts Yampa / White Rivers generally peaked in June Very high (many records) snowpack Cool June somewhat mitigated high flows although rivers flowed high for several weeks
Upper Colorado Upper Colorado includes many high elevation basins that peaked late into June or early July Near record snowpack caused high flows High flows were mitigated by cool June temperatures
Gunnison Gunnison basin divided wet conditions to the north and near average to the south. Hwy 50 was a rough dividing line Peaks mostly in early June with continued high flows through June and even July (monsoon moisture)
2010 Summary • 2011: cool and wet spring made for unique hydrology. Both long lead and daily forecasts performed relatively well. • More forecast verification: • Temperature forecasts • Water supply forecasts • Forecast Issues • Struggled with some reservoir release plans in some cases • Temperature forecasts in late May / early June were much too high causing streamflow forecasts to be too high • Upcoming CBRFC activities • November 4 stakeholder forum – Denver, CO • Annual recap and outlook webinar – Oct/Nov • Individual meetings with water managers
30 year average update • 30 year averages are updated once every 10 years • Currently using • 1971-2000 for averages • 1971-2000 for statistical prediction • 1976-2005 for ESP • Update for WY2012 will be based on 1981-2010 averages • Trends in monthly precipitation are important for ESP
Preliminary Data • 18% reduction in mean
Preliminary Data • 4% reduction in mean
Preliminary Data • 6% reduction in mean
Preliminary Data • 6% reduction in mean
Preliminary Data • 11% reduction in mean
Preliminary Data • All 30 year means since 1911-1940
Affect on Forecasts • WY2011 forecasts continue to use 1971-2000 means: • Statistical models (SWS and NRCS) will use 1971-2000 • Simulation model (ESP) will use 1976-2005 • WY2012 forecasts will be based on 1981-2010 inputs in both forecast models • ESP and SWS will both use the same period • SNOTEL network much stronger for 1981-2010 period than in 1970s. This network is critical for forecast skill. • All things equal, these forecasts will be lower since input data sets are drier in the 30 year average • Especially true in early season forecasts • Later season forecasts more controlled by observed snowpack • Percent of normal forecast values should remain largely unchanged (since normals AND forecasts will be lower)
Kevin Werner CBRFC Service Coordination Hydrologist Phone: 801.524.5130 Email: kevin.werner@noaa.gov Feedback, Questions, Concerns always welcome….