Download
1 / 37
370 likes | 498 Views
MEET PAT The Performance Assessment Template. Emily Thomas Director of Planning and Institutional Research emily.thomas@stonybrook.edu. QUESTION: How did a group of students perform?. Learning Communities freshmen Scholarship recipients Athletes Honors society students Transfers.

E N D
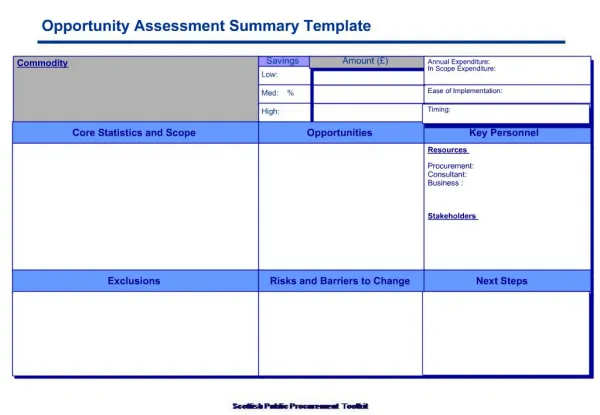
MEET PATThe Performance Assessment Template Emily Thomas Director of Planning and Institutional Research emily.thomas@stonybrook.edu
QUESTION:How did a group of students perform? • Learning Communities freshmen • Scholarship recipients • Athletes • Honors society students • Transfers
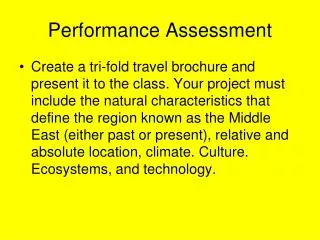
PerformanceAssessmentTemplate Create a standard procedure/write a program to • Assemble variables that characterize students and their performance • Display those variables to assess the performance of a particular group of students
Two Kinds of Assessment Assessment of how students perform Standard data and outcomes Often comparative analysis vs Assessment of learning No standard measures Often intracranial variables
Pat’s Tasks • Identify variables that describe studentsand their performance • Locate those variables • Extract those variables to a reporting table • Design standard summary reports • Design a report to display student detail
Name Gender Ethnicity Citizenship SATs: math/verbal/combined High school High school location High school average Freshman/transfer entrance Resident/commuter Credits transferred at entry Math placement score grade Writing placement score grade Transfer institution Special admit: EOP, athlete, other at risk, Honors College, WISE Split variables Athlete Learning Community student Scholarship recipient Possible additions Age Income English as 2nd language Home county/state Describing Students
Term data Registered? Credits completed Term GPA Cumulative GPA Credits completed in term Cumulative credits Credits transferred Class standing Academic standing Dean’s list? Major(s) Minor(s) Course detail Courses taken Grades Degree Degree Degree field Describing Performance
Pat’s Data • Student-level data to describe students • Term-level data to summarize performance • Course-level detail • Degree data Linked by student id and term id
Pat’s Programming Lessons • SAS and SPSS access databases like Oracle very easily. • SQL (structured query language) is a powerful IR tool, especially for multitable data. • Ideally, institutional researchers should be able to use warehouse tables structured to support reporting. • The data design for a performance assessment project provides specs for warehouse tables. • Many/most IR projects can be done with SAS or SPSS tables.
SAS Database Read/SQL Code LIBNAME PS ORACLE PATH=HE80PROD SCHEMA=SYSADM USER=ETHOMAS DBPROMPT=YES ; PROC SQL ; CREATE TABLE PAT.SEMESTER AS SELECT EMPLID, STRM, REGISTERED, ACAD_LEVEL_BOT, UNT_TEST_CREDIT, UNT_TRNSFR, UNT_PASSD_PRGRSS, TOT_CUMULATIVE, CUR_GPA, CUM_GPA FROM PS.PS_STDNT_CAR_TERM WHERE (STRM BETWEEN '0988' AND '1048') AND ACAD_CAREER = 'UGRD' ; DATA PAT.SEMESTER ; SET PS.PS_STDNT_CAR_TERM ; RUN ;
SAS Table Code ODS RTFFILE = "X:\OIR\SAS Programs\PAT\Learning Communities\LC 1998 summary.rtf" STYLE=SIMPLE10 ; PROC TABULATE MISSING ; CLASS GROUP VALUE SPLIT ; FORMAT SPLIT S. GROUP GG. VALUE $V. ; KEYLABEL ALL = '*TOTAL' ; TABLE GROUP=' '*(VALUE=' ' ALL) , (SPLIT='Number' ALL='All freshmen') * N=' '*F=COMMA11.0(SPLIT='Percent' ALL='All freshmen') * PCTN<VALUE ALL>=' '*F=COMMA10.1 / RTS=40 MISSTEXT = ' ' ; TITLE1 'LEARNING COMMUNITY STUDENTS' ; TITLE2 'AND OTHER FULL-TIME FRESHMAN ENTERING FALL 1998' ; TITLE3 'CHARACTERISTICS' ; ODS CLOSE ;
SPSS Table Code CTABLES /VLABELS VARIABLES=SPLIT display=none /vlabels variables= XSEX XETHNIC XCITCODE DISPLAY=DEFAULT /TABLE XSEX [COUNT F40.0, COLPCT.COUNT PCT40.1 ] + XETHNIC [COUNT F40.0, COLPCT.COUNT PCT40.1 ] + XCITCODE [COUNT F40.0, COLPCT.COUNT PCT40.1 ] BY SPLIT [C] /CATEGORIES VARIABLES=SPLIT ORDER=A KEY=VALUE EMPTY=INCLUDE TOTAL=YES POSITION=AFTER /CATEGORIES VARIABLES=XSEX XETHNIC XCITCODE ORDER=A KEY=VALUE EMPTY=INCLUDE TOTAL=YES POSITION=AFTER /TITLES TITLE= 'LEARNING COMMUNITY STUDENTS' 'AND OTHER FULL-TIME FRESHMEN ENTERING FALL 1998' 'CHARACTERISTICS'.
Pat’s Reports:Student Characteristics • Demographics: number and percent by gender, ethnicity, citizenship • SATs and high school average: mean, median, minimum, maximum, number • Admission categories: number and percent who are in EOP, other at-risk groups, Honors College, WISE, academic scholarship recipients
Pat’s Reports:Performance by Term (1) • Term enrollment: Number and percent enrolled, graduated, percent living on campus • Term statistics: average semester GPA, cumulative GPA, semester credits, total credits, test credits, transfer credits • Class standing: Number and percent by term (freshman, sophomore, junior senior) • Dean’s list: number and percent • Good academic standing: number and percent • Academic standing: number in each category
Pat’s Reports:Performance by Term (2) • Majors by term: first major, number by term • Major in entry term: first major, number and percent in entry term • Second majors and minors: number by term • Degrees: number by major by term
Pat’s Reports:Details • Grade distribution: course or percent grade distribution for target group • Grades in key courses: number and percent for selected courses • Student-level detail: transcript data plus entry characteristics * With filter to select students who dropped below good academic standing or left/missed a semester
Conclusions • Performance assessment projects have enough commonality to make it efficient to create a template. • SPSS and SAS can create the template. • The programming is complicated, and each project has its own complications. • Ideally, the data source should be data warehouse tables designed to support reporting. • A performance assessment template can contribute to the design of warehouse tables. • Standard reports are often only the first phase of an assessment project, but assembling the data for standard reports lays the foundation for additional analyses.