Download
1 / 35
370 likes | 595 Views
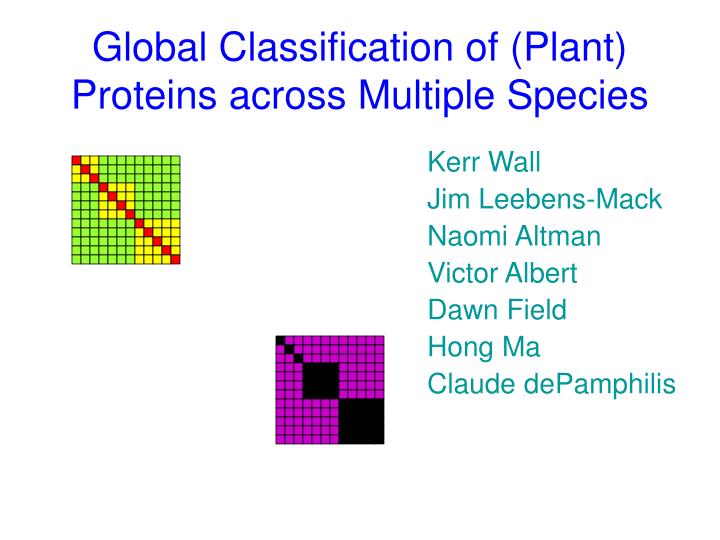
Global Classification of (Plant) Proteins across Multiple Species. Kerr Wall Jim Leebens-Mack Naomi Altman Victor Albert Dawn Field Hong Ma Claude dePamphilis. Global Classification of Proteins. The protein classification problem A method for global classification

E N D
Global Classification of (Plant) Proteins across Multiple Species Kerr Wall Jim Leebens-Mack Naomi Altman Victor Albert Dawn Field Hong Ma Claude dePamphilis
Global Classification of Proteins • The protein classification problem • A method for global classification • “Bootstrap” support for global classification • Structure within clusters • Structure between clusters • Results from complete proteome classification: arabidopsis, oryza and populus
The protein classification problem • Genomic sequence can be translated into protein sequence but … • The function of most proteins is unknown. • Protein classification is used to: • infer protein folding structure • infer protein function • infer evolutionary relationships **
Similarity of Protein Sequence FFHPLECEPTLQMGFHSDQIS-VAA---AGPS--VNNN--- FFHPLDCGPTLQMGYPSDSLTAEAAASVAGPS--C--S--- FFHPLECEPTLQIGYQPDPIT-VAA---AGPS--VN-NYMP FFHPIECEPTLQMGYQQDQIT-VAAA--AGPSMTMN-S--- FFQHIECEPTLHIGYQPDQIT-VAA---AGPS--MN-NYMQ FFHPLECEPTLQIGYQHDQIT-IAA---PGPS--VS-NYMP • Each row represents a different protein. • Each letter represents an amino acid. • Each “–” represents a space which is missing in this sequence but has something in it in a different protein in this set. • In closely related proteins, the distance between proteins is the number of mismatches. • In distantly related species, the sequences are given a score – often the probability that a random sequence matches as well (e.g. BLAST E-value)
Inferring Evolutionary Relationships Main methods: statistical phylogeny based on sequence alignment and evolutionary models -requires a high degree of sequence similarity -good alignments use slow algorithms and often lots of manual intervention manual curation -requires a large amount of manual intervention -can incorporate sequence, folding structure and function. These methods are good for 100’s of genes.
Global Classification of Proteins Very high throughput: Our goal: The joint classification of all known plant proteins using a “scaffold” derived from the 3 completely sequenced species
A method for global classification • Clustering based on a similarity (or distance) matrix is commonly used. • A quick method for clustering (sparse matrix computations are often used). • Our similarity matrix is 129,677 x 129,677 so we need: • A quick method for computing distance (BLAST E-values are often used; we use -log(E-value) as the similarity measure)
TribeMCL Clustering Algorithm Predicted protein sequences from the fully sequenced genomes of Arabidopsisthaliana columbia (26207) and Oryza sativa japonica (57915) were downloaded from TIGR. Populus trichocarpa (45555) was downloaded from JGI. All sequences were blasted against each other using BLASTp 2.4 with an E-value cutoff of 1x10⁻⁵ The TribeMCL package was used to predict putative protein families at low, medium, and high (I=1.2,3,5) stringencies The results are stored at http://www.floralgenome.org/cgi-bin/tribedb/tribe.cgi
TribeMCL MethodEnright, Van Dongen and Ouzounis (2002) • Similarity is measured by -log10(BLAST E-value) • Clustering is done by MCL Method
MCL Algorithmvan Dongen, 2000 Suppose S is the similarity matrix. • Normalize the rows of S to sum to 1. • Raise each entry to the power r>1. (r is the “stringency”) and renormalize. S(r) • Take a “Markov step” – replace S(r)’S(r). • Iterate to convergence. It is very fast because low similarities are truncated to zero and sparse matrix methods can then be used.
A Heuristic for MCL We take a random walk on the graph described by the similarity matrix BUT After each step we weaken the links between distant nodes and strengthen the links between nearby nodes Graphic from van Dongen, 2000
16 40 60 r=2.0 Similarity Matrix r=2.6 Cluster pattern at Convergence as a function of r r=2.8 Small groups break apart first. The pattern is quite robust to changes in the similarity of the green region r=2.9
r=2.0 Similarity Matrix Cluster pattern at Convergence as a function of r At r=3.6 all units separate r=2.6 16 40 60 50 r=2.8 The additional similarity indicated by pink has a profound effect r=3.1
30 40 60 r=2.0 Similarity Matrix Cluster pattern at Convergence as a function of r r=2.6 More strongly connecting the “background” disrupts the pattern until r=2.7, after which we quickly cycle through the pattern (2.9 turns the center group into singletons and 3.0 turns everything into singletons.) r=2.7 r=2.8
16 30 60 r=2.0 Similarity Matrix r=2.1 Cluster pattern at Convergence as a function of r r=2.3 Weakening the within cluster similarity accelerates the breakdown into singletons
25 30 60 r=2.0 Similarity Matrix Cluster pattern at Convergence as a function of r r=2.3 Strengthening the “background” while weakening the within cluster similarity makes it difficult to pick out the clusters.
Comparing Tribes to Phylogenetic Trees from Sequence Alignment Tribes for large gene families show some, but not complete correspondence to inferred phylogenetic relationships. Tribes with MADS genes formed at low, medium and high stringencies are mapped on to the a recently published Arabidopsis MADS gene phylogeny (Martinez-Castilla & Alvarez-Buylla 2003).
Comparisons with curated gene families • Added tribe information to TAIR’s gene families • www.floralgenome.org/cgi-bin/tair/tair.cgi • E.g. Cytochrome P450
“Bootstrap” Support for Clusters To determine the stability of the clusters, we need some type of perturbation of the system. We use the “0.632 jackknife” instead of the bootstrap (as we want a set of unique proteins). We clustered 100 samples, each a random selection of 63.2% of the proteins. We count “1” for each tribe each time all the genes in the tribe selected for the bootstrap sample are clustered.
From Tribes to Phylogenetics • Within each tribe of 3 or more proteins we can do hierarchical clustering using the similarity matrix (Harlow, Gogarten, Ragan, 2004) or forming a careful alignment and doing phylogenetic tree. • We can also form SuperTribes, by clustering the tribes. Because we still have a large set of objects to cluster, we continue to use MCL. • Within a SuperTribe, we can do hierarchical clustering. • The SuperTribe for the MADS family shown earlier includes all the MADS sequences
Single Linkage TribeMCL Single Linkage Tribe MCL • Define the distance between tribes as the smallest pairwise E-value. • Use TribeMCL on the resulting similarity matrix. • Use hierarchical clustering within supertribes. Hierarchical clustering or phylogenetic trees
Use of the Global Classification • Project goal is to understand the evolution of flowers. • Data has been collected to various degrees of intensity on 15 non-model species across the phylogeny of flowering plants and merged with data from other projects. • PlantTribes will be used to assist in placing these proteins into families to infer evolutionary relationships.
And many thanks to: • Kerr Wall – FGP Bioinformatics (PSU) • Claude dePamphilis – FGP PI (PSU) • Jim Leebens-Mack – FGP Project Director(PSU) • Hong Ma – FGP co-PI (PSU) • Victor Albert – collaborator (U. Oslo) • Dawn Field – collaborator (Oxford U.) And FGP collaborators at PSU, UFL and Cornell. And especially NSF – Plant Genome Research Program