Download
1 / 46
460 likes | 552 Views
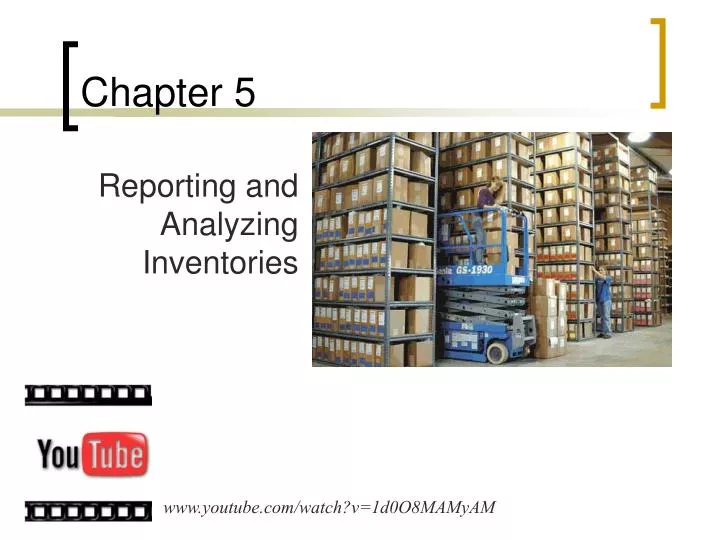
Reporting and Analyzing Inventories. Chapter 5. www.youtube.com/watch?v=1d0O8MAMyAM. Determining Inventory Items. C 1. Merchandise inventory includes all goods that a company owns and holds for sale, regardless of where the goods are located when inventory is counted.

E N D
Reporting and Analyzing Inventories Chapter 5 www.youtube.com/watch?v=1d0O8MAMyAM
Determining Inventory Items C 1 Merchandise inventory includes all goods that a company owns and holds for sale, regardless of where the goods are located when inventory is counted. Items requiring special attention include: Goods in Transit Goods Damaged or Obsolete Goods on Consignment 5-2
FOB Shipping Point Public Carrier Seller Buyer Ownership passes to the buyer here. Public Carrier Seller Buyer FOB Destination Point Goods in Transit C 1 5-3
Determining Inventory Costs C 2 Includes all expenditures necessary to bring an item to a salable condition and location. Invoice Cost Minus Discounts and Allowances PlusInsurance Plus Import Duties PlusFreight Plus Storage 5-4
Most companies take a physical count of inventory at least once each year. Prenumbered Inventory Tickets are attached to items. Counters separate from those who have inventory responsibilities are used. Counters verify the existence, amount & quality of inventory. Second count done by someone else. Inventories are ticketed only once. When the physical count does not match the Merchandise Inventory account, an adjustment must be made. Internal Controls and Taking a Physical Count C 2 5-6
Costing Method - How do I value the inventory? Specific Identification, FIFO, LIFO, or Weighted Average Inventory System - How often do I book journal entries? Perpetual or Periodic Perpetual: Records the COGS and reduction in Merchandise Inventory immediately at the time of sale. Periodic: Records the COGS and reduction in inventory at the end of a time period (I.e. monthly, quarterly, etc.) Inventory Costing Under a Perpetual System P1 Accounting for inventory requires several decisions . . . 5-7
Inventory Cost Flow Assumptions P1 First-In, First-Out(FIFO) Assumes costs flow in the order incurred. Last-In, First-Out(LIFO) Assumes costs flow in the reverse order incurred. Weighted Average Assumes costs flow at an average of the costs available. 5-9
Because prices change, inventory methods nearly always assign different cost amounts. Financial Statement Effects of Costing Methods A1 5-10
Smoothes out price changes. Ending inventory approximates current replacement cost. Better matches current costs in cost of goods sold with revenues. Financial Statement Effects of Costing Methods A1 Advantages of Methods Weighted Average First-In, First-Out Last-In, First-Out 5-11
The consistency concept requires a company to use the same accounting methods period after period so that financial statements are comparable across periods. Consistency in Using Costing Methods A1 5-12
Go Over Inventory Comparison Handout • Go over Ex. 5-3 & 5-4
Inventory must be reported at market value when market is lowerthan cost. Defined as current replacement cost (not sales price). Consistent withthe conservatismprinciple. Lower of Cost or Market P2 Can be applied three ways: (1) separately to each individual item. (2) to major categories of assets. (3) to the whole inventory. 5-14
A motorsports retailer has the following items in inventory: Lower of Cost or Market P2 5-15
Here is how to compute lower of cost or market for individual inventory items. Lower of Cost or Market P2 5-16
Lower of Cost or Market P2 Here is how to compute lower of cost or market for the two groups of inventory items. 5-17
Lower of Cost or Market P2 Here is how to compute lower of cost or market for the entire inventory. 5-18
Shows how many times a company turns over its inventory during a period. Indicator of how well management is controlling the amount of inventory available. Cost of goods sold Inventory = Turnover Avg. inventory Inventory Turnover A3 5-20
Ending Inventory Days' Sales in × = 365 Inventory Cost of goods sold Days’ Sales in Inventory A3 How long does inventory sit in the warehouse before it leaves as a Sale. 5-21
Inventory Valuation Calculations Slides 23 - 45 for reference only.
Inventory Costing Illustration P1 5-24
Specific Identification P1 The above purchases were made in August. On August 14, a company sold eight bikes originally costing $91 and 12 bikes originally costing $106. 5-25
Specific Identification P1 The Cost of Goods Sold for the 20 bikes old on the August 14 sale is $2,000. 8 bikes @ 91 = $ 728 12 bikes @ 106 = $1,272 After this sale, there are five units in inventory at $500: 2 bikes @ $91 = $ 182 3 bikes @ $106 = $ 318 5-26
Specific Identification P1 Additional purchases were made on August 17 and 28. The cost of the 23 items sold on August 31 were as follows: 2 @ $91 3 @ $10615 @ $115 3 @ $119 5-27
Cost of Goods Sold for August 31 = $2,582 Specific Identification P1 5-28
Specific Identification P1 Here are the entries to record the purchases and sales. The numbers in red are determined by the cost flow assumption used. All purchases and sales are made on credit.The selling price of inventory was as follows: 8/14 $130 8/31 150 5-29
First-In, First-Out (FIFO) P1 The above purchases were made in August. On August 14, the company sold 20 bikes. 5-30
First-In, First-Out (FIFO) P1 The Cost of Goods Sold for the August 14 sale is $1,970. After this sale, there are five units in inventory at $530: 5 @ $106 5-31
Cost of Goods Sold for August 31 = $2,600 First-In, First-Out (FIFO) P1 5-32
Income Statement COGS = $4,570 Balance Sheet Inventory = $1,420 First-In, First-Out (FIFO) P1 5-33
First-In, First-Out (FIFO) P1 Here are the entries to record the purchases and sales entries. The numbers in red are determined by the cost flow assumption used. All purchases and sales are made on credit.The selling price of inventory was as follows: 8/14 $130 8/31 150 5-34
Last-In, First-Out (LIFO) P1 The above purchases were made in August. On August 14, the company sold 20 bikes. 5-35
Last-In, First-Out (LIFO) P1 The Cost of Goods Sold for the August 14 sale is $2,045. After this sale, there are five units in inventory at $455: 5 @ $91 5-36
Cost of Goods Sold for August 31 = $2,685 Last-In, First-Out (LIFO) P1 5-37
Income Statement COGS = $4,730 Balance Sheet Inventory = $1,260 Last-In, First-Out (LIFO) P1 5-38
Last-In, First-Out (LIFO) P1 Here are the entries to record the purchases and sales entries. The numbers in red are determined by the cost flow assumption used. All purchases and sales are made on credit.The selling price of inventory was as follows: 8/14 $130 8/31 150 5-39
When a unit is sold, theaverage costof each unit in inventory is assigned to cost of goods sold. ÷ Cost of Goods Available for Sale Units on hand on the date of sale Weighted Average P1 5-40
÷ Weighted Average P1 First, we need to compute the weighted average cost per unit of items in inventory. The Cost of Goods Sold for the August 14 sale is $2,000.After this sale, there are five units in inventory at $500: 5-41
Weighted Average P1 Additional purchases were made on August 17 and 28. Twenty-three bikes were sold on August 31. What is the weighted average cost per unit of items in inventory? 5-42
÷ Weighted Average P1 5-43
Cost of Goods Sold for August 31 = $2,622 Weighted Average P1 Ending inventory is comprised of 12 units @ an average cost of $114 each or $1,368. 5-44
Income Statement COGS = $4,622 Balance Sheet Inventory = $1,368 Weighted Average P1 5-45
Weighted Average P1 Here are the entries to record the purchases and sales entries for Trekking. The numbers in red are determined by the cost flow assumption used. All purchases and sales are made on credit.The selling price of inventory was as follows: 8/14 $130 8/31 150 5-46