Download
1 / 36
360 likes | 496 Views
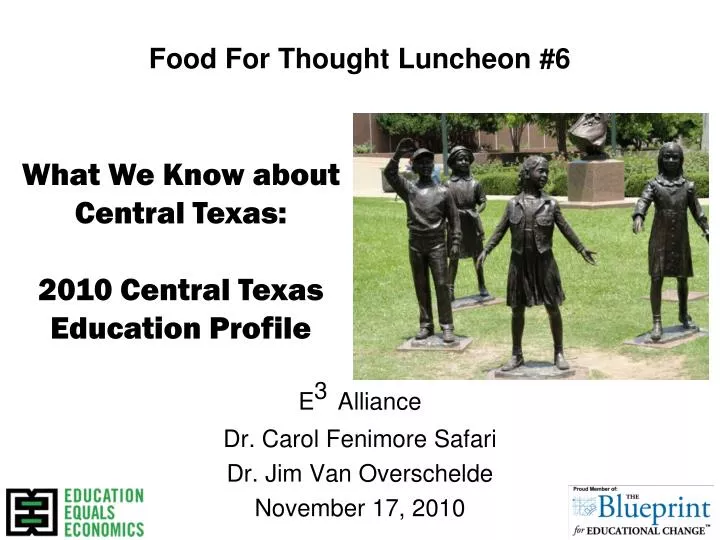
What We Know about Central Texas: 2010 Central Texas Education Profile. Food For Thought Luncheon #6. E 3 Alliance Dr. Carol Fenimore Safari Dr. Jim Van Overschelde November 17, 2010. Central Texas Demographic Changes.

E N D
What We Know about Central Texas: 2010 Central Texas Education Profile Food For Thought Luncheon #6 E3Alliance Dr. Carol Fenimore Safari Dr. Jim Van Overschelde November 17, 2010
Central TexasDemographic Changes E3 Alliance analysis of 2008-09 TEA student data retrieved January 2010 from http://ritter.tea.state.tx.us/perfreport/aeis/2009/download.html.
% Low Income, 1998-99 Publicly available 1998-99 TEA student data retrieved from http://ritter.tea.state.tx.us/perfreport/aeis/99/xplore/DownloadSelData.html retrieved in January 2010. Map prepared by Garrett Groves
Texas Workforce Commission (www.tracer2.com) and Federal Reserve Bank of Dallas (http://dallasfed.org/data/topic.html)
Source: E3 Alliance analysis of workforce projections and salary data from Economic Modeling Specialists, Inc.(EMSI) and the United States Bureau Labor.
Education Required for New High-Wage, High-Growth Jobs in Central Texas, 2009-2019 Source: E3 Alliance analysis of workforce projections and salary data from Economic Modeling Specialists, Inc.(EMSI) and the United States Bureau Labor.
2008-09Student Achievement E3 Alliance analysis of 2008-09 TEA student data retrieved January 2010 from http://ritter.tea.state.tx.us/perfreport/aeis/2009/download.html.
Graduation and College & Career Readiness 2004-05 1st time 9th Graders* 2003-04 1st time 9th Graders** 2007-08 High School Graduates*** *All CTX Students including charter schools **34 CTX Districts, not including students who moved ***8 Districts that participated in the Student Futures Project
Source: Ad Hoc PEIMS Data Request Compiled by Texas Education Agency
Source: Ray Marshall Center Student Futures Project, University of Texas – Austin, May 2009. Participating districts: Austin, Eanes, Bastrop, Hays, Leander, Manor, Pflugerville, Round Rock, and San Marcos
Source: Ray Marshall Center Student Futures Project, University of Texas Austin
Student growth Moving Forward
Measuring Student Growth Prior School Year Summer Current School Year Equal? TAKS TAKS Growth