Download
1 / 26
300 likes | 676 Views
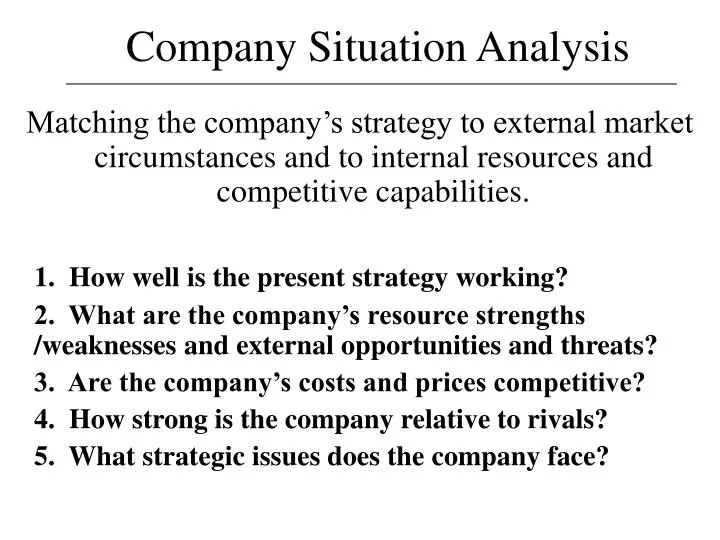
Company Situation Analysis. Matching the company’s strategy to external market circumstances and to internal resources and competitive capabilities. 1. How well is the present strategy working? 2. What are the company’s resource strengths /weaknesses and external opportunities and threats?

E N D
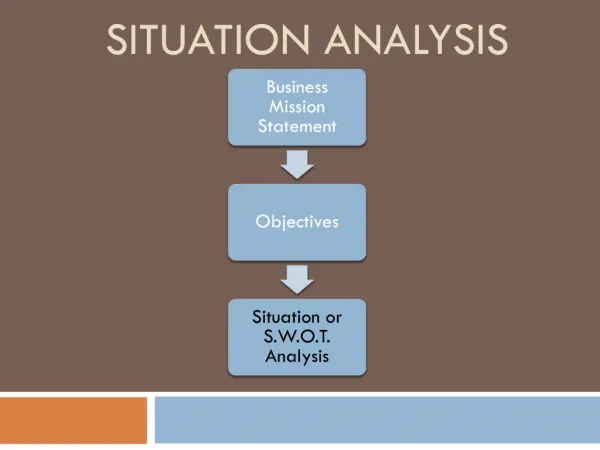
Company Situation Analysis Matching the company’s strategy to external market circumstances and to internal resources and competitive capabilities. 1. How well is the present strategy working? 2. What are the company’s resource strengths /weaknesses and external opportunities and threats? 3. Are the company’s costs and prices competitive? 4. How strong is the company relative to rivals? 5. What strategic issues does the company face?
1. How well is the current strategy working? What is the current strategy? Is it achieving financial/strategic objectives? Is market share increasing/decreasing? Trends in profit margin, net profit, ROI, stock price, sales?
2. SWOT Analysis Identifying: Company STRENGTHS & competitive capabilities; Company WEAKNESSES & resource deficiencies; Company market OPPORTUNITIES; THREATS to a company’s future profitability…..
SWOT - Strengths & Weaknesses Sources of Strength or Weakness Skill or expertise (or lack of) Physical assets - plant, equipment, location (or lack of) Human assets / expertise (or lack of) Organisation assets - quality control system, patents Valuable intangible assets - brandname, loyalty, culture Competitive capabilities - shorter development times, customising capability, supplier relations. Strategic Balance Sheet - Competitive Assets & Liabilities
Core & Distinctive Competencies Core competence is something a company does well relative to other internal activities. Distinctive competence is something a company does well relative to competitors. Whether a core competence represents a distinctive competence depends on how good the competence is relative to what competitors are capable of.
SWOT Analysis - Opportunities/Threats Not every industry opportunity/threat is a company opportunity/threat - need to analyse and compare: Impact on growth & profit potential Impact on existing / potential sources of competitive advantage Match with company resource capabilities
Drawing Conclusions from SWOT Analysis How best to deploy resources in view of the company’s internal/external situation Does the resource base need to be adjusted to respond to emerging issues? Are there resource gaps that need to be filled? In what ways does the company need to strengthen its (future) resource base?
3. Are company prices/costs competitive? • Cost disparities can stem from: • Difference in raw materials prices • Difference in technology used • Difference in age of plant/equipment • Difference in production costs • Difference in marketing, sales, promotion & • advertising costs • Difference in exposure to inflation/taxes etc.
Strategic Cost Analysis - Benchmarking Benchmark the costs of key activities to understand the best practices involved in performing an activity and to see if costs are in line with other companies. Use info. from published reports, trade groups, industry analysts, customers, suppliers.... Used to identify areas of cost advantage/disadvantage.
Strategic Cost Analysis Business as a collection of activities with costs = cost structure Compare a company’s costs activity by activity against those of rivals. Learn which internal activities are a source of cost advantage or disadvantage.
Cost Analysis - Company Value Chain Primary analytical tool of strategic cost analysis Identifies the separate activities, functions and processes used in designing, producing, marketing, delivering and supporting a product or service. Identifies the primary activities that create value for customers and the related support activities.
Cost Analysis - Company Value Chain Primary Activities & Costs Sales & Marketing Purchasing Operations Distribution Service Profit Support Activities & Costs R & D; Technology; HRM; Administration
Cost Analysis - Company Value Chain Value chains of rival companies differ. Company value chain is embedded in larger Value Chain System - part of and affected by value chains of upstream suppliers and downstream customers.
SOFT DRINKS Processing ingredients Syrup manufacture Bottling/Can Filling Wholesale distribution Retailing SOFTWARE Programming Disk Loading Marketing Distribution ACCOUNTANCY Human Resource Management Customer Service Value Chain Composition Differs by Industry & by Company
THE VALUE CHAIN SYSTEM Upstream Company Downstream Value Chains Value Chain Value Chains Activities, Costs, and Margins of Suppliers Internally Performed Activities, Costs and Margins Activities, Costs, Margins of Forward Channels END USER Adapted from Michael Porter, Competitive Advantage, 1985.
Strategic Options for Achieving Cost Competitiveness Options to combat upstream disadvantage: Negotiate more favourable prices with suppliers Work with suppliers to help reduce costs Integrate backwards Source cheaper substitutes Manage linkage between supplier & co. Eg JIT
Strategic Options for Achieving Cost Competitiveness Options to combat downstream disadvantage: Push distributors/forward channels to markups Look for win-win opportunities to costs Change to more economical distribution strategy Forward integrate
Strategic Options for Achieving Cost Competitiveness Options to combat internal disadvantage: Streamline high cost activities Reengineer business processes / work practices Re-vamp value chain to eliminate some activities Outsource activities if more economical Invest in cost-saving technology Simplify product design
4. How strong is the company’s competitive position? Whether mkt position will improve/deteriorate if present strategy continued? How the firm ranks relative to key rivals on each industry success factor and each relevant measure of competitive strength Whether the firm has a competitive advantage / disadvantage v.a.v rivals Firm’s ability to defend mkt position in light of industry driving forces
Competitive Strength Assessment Identify industry’s KSFs/determinants of competitive advantage/disadvantage (usually 6 - 10 measures) Rate firm and key rivals on each indicator (scale 1-10) Sum individual ratings = competitive strength Note which companies are strongest and areas of relative strength & weakness
Competitive Strength Assessment EXAMPLE KEY INDICATORS CO.A CO.B CO.C PRODUCT QUALITY 8 6 3 BRAND IMAGE 9 6 3 CUSTOMER SERVICE 7 8 5 OPERATING COSTS 4 7 8 EXPERTISE 8 8 6 R & D 9 7 1 45 42 29 Overall Strength Rating
Weighted CSA Key indicators Weighting co.A co.B co.C Product quality .2 8/1.6 6/1.2 3/.6 Brand image .05 9/.45 6/.3 3/.15 Customer service .2 7/1.4 8/1.6 5/1.0 Operating costs .3 4/1.2 7/2.1 8/2.4 Expertise .1 8/.8 8/.8 6/.6 R & d .15 9/1.35 7/1.05 1/.15 Sum of weights 1.0 Weighted overall strength rating 6.8 7.05 4.9
Strategic Group Mapping Identify characteristics that differentiate firms in the industry Identify and group firms with similar competitive approaches Plot firms on a two variable map using pairs of these differentiating characteristics Draw circles around each group proportionate to size of groups’ respective share of total industry sales revenue
Strategic Group Mapping Distinguishing characteristics: price/quality range; geog scope; vertical integration; pdt line breadth; distribution channels; service; pdt attributes; technology Number of groups - spread of groups A number of maps can be useful Whether some groups affected more by certain ind. forces Movement between groups
Strategic Mapping - Jewellery Industry High PRICE QUALITY IMAGE Med Low Specialty Full line craft Diamonds/ jewellers Watches etc Ltd category merchandise retailers Broad category retailers PRODUCT LINE BREADTH
5. What strategic issues does the company face? Does the company have a competitive advantage? Does it capitalise on resource strengths? Which opportunities should be prioritised? What corrective measures need to be taken? How does the cost position compare to that of rivals? Does the present strategy defend against the 5 forces? Is it closely matched to the industry’s KSFs? Should it be adjusted to better respond to driving forces?