Download
1 / 17
170 likes | 245 Views
Data Fusion for the Description and Explanation of Atmospheric Aerosols. R. B. Husar and S.R. Falke Center for Air Pollution Impact and Trend Analysis (CAPITA) Washington University, St. Louis, MO Prepared for Presentation at 8 th Int. Assoc. of Meteorology and Atm. Sciences, IAMAS Assembly

E N D
Data Fusion for the Description and Explanation of Atmospheric Aerosols R. B. Husar and S.R. FalkeCenter for Air Pollution Impact and Trend Analysis (CAPITA) Washington University, St. Louis, MO Prepared for Presentation at 8th Int. Assoc. of Meteorology and Atm. Sciences, IAMAS Assembly Innsbruck, Austria, 10-18 July, 2001
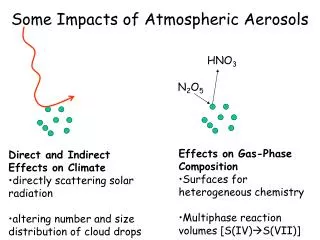
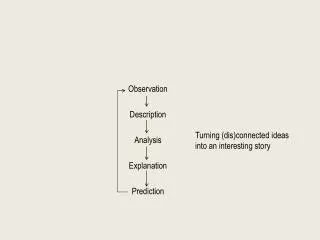
Objectives of Atmospheric Aerosol Data Fusion: Description: What, Where, When Aerosol is a 6+ dimensional system (x, y, z, t, size, composition). Each sensor samples a small subset of the aerosol data space; or some integral measures of the 6D aerosol distribution Combination of sensors yields a somewhat more complete aerosol pattern in space, time, size, composition Explanation: Why, How The explanation establishes causality of pattern through processes. Processes include emission, transport, transformations and removal Combined data on processes yields the science, i.e. the explanation
Sensor, Pixel and Feature-Level Fusion • Sensor-level fusion is taking place in the instrument or early data processing • Pixel-level fusion combines data from multiple ‘platforms’; requires georeferencing, time referencing • Feature-level fusion requires extraction of features, i.e. pattern • The ‘object’ is described by its features
Data Fusion for Enhanced Description (Pattern) • Spatial Pattern and Height of Asian Dust • Spatial Pattern and Height of Sahara Dust • Elevation of Central American Smoke
Gobi Dust, Apr 15, 19 1998 • SeaWiFS records columnar AOT; TOMS is sensitive to upper layer dust. • Aerosol features derived from the combination of SeaWiFS, TOMS, Winds Speed and Visibility data: • On April 15 the dust plumes over Gobi are seen in SeaWiFS but not on TOMS. • On April 19 both satellite sensors and surface visibility indicates dust. • Hence, the April 16 plume is surface-based while the April 19 plume reaches from ground to high elevation.
Topography: Sahara Dust Near the Surface 3D View SeaWiFS shows a dense dust layer emanating from W. Africa 3D view shows that shallow islands are submerged in dust, while high islands extrude from the ~1 km deep dust layer
Continental Surface Visual Range, Extinction Coefficient • Visibility is recorded at 7000+ surface stations hourly
In West-Central Africa, winter haze is surface- based; summer haze is elevated Based on AERONET Sun Photometer Network, NOAA SOD Visibility data • In Jan-Feb the horizontal (Bext) extinction and vertical optical thickness (AOT) are correlated. • This implies that the haze is surface-based and has a scale-height of of about 1 km. • In Jun-Jul, the Bext is below detection limit, while the AOT is the same as in Jan-Feb. • Evidently, the summer dust layer is elevated while the surface layer is dust-free.
Central American Smoke, May 1998 • On May 14, 15 SeaWiFS shows dense smoke over S. Mexico; low TOMS -> lower level smoke • On May 14, high SeaWiFS, TOMS and Bext over Texas -> smoke at low and hi elevation • On May 15, SeaWiFS, TOMS and Bext coincide over EUS -> well mixed surface smoke
Topography: Smoke Confined to Low Elevations • On May 14, C. American smoke was confined to low elevations • The high plateau extrudes from smoke • In California, Oct 18 99, smoke in the Sierras fills the the Central Valley • Smoke exits to the Pacific through a gap
Data Fusion for Explanation of Causality • Emission Region of Elevated Sahara Dust, JJA • Spatial Pattern and Height of Sahara Dust • Elevation of Sahara Dust and Biomass Smoke • Elevation of Central American Smoke
Dust Dunes based on Satellite Radar NASA NSCAT Program • Low surface roughness from 2 cm radar indicates sand dunes smooth surface (red) • Extensive dunes are evident over Sahara, S. Arabia and E. Central Asia
Dust Source Regions Sand dunes from NSCAT NASA TOMS and NSCAT The combined TOMS and NSCAT satellite data indicates: In JJA, the largest source of high-elevation dust is in Mali-W. Africa.
Biomass Fires (ESA-IONIA) and Vegetation (NDVI) • Arid regions (deserts) and rainforests are void of biomass fires • Fires are confined to narrow range of NDVI)
Fire Zones of North America FIRE and Norm. Diff. Veg. Index, NDVI The ‘Northern’ zone from Alaska to Newfoundland has large fire ‘patches’, evidence of large, contiguous fires. The ‘Northwestern’ zone (W. Canada, ID, MT, CA) is a mixture of large and small fires The ‘Southeastern’ fire zone (TX–NC–FL) has a moderate density of uniformly distributed small fires. The ‘Mexican’ zone is the most intense fire zone, sharply eparated from arid and the lush regions. Fires are absent in arid low-vegetation areas (yellow) and over areas of heavy, moist vegetation (blue).
Fires and Elevation Western US (1996-2000) • Fire locations over the Western US are mainly at higher elevations
Resistances to Data Fusion: Mechanical and ‘Other’ • Data are increasingly exposed through the Internet but how do I find it and combine it with other data? • Need a catalog the aerosol-related resources for finding the resources. • Need rudimentary standards to help data flow from producers through value-adding processors to to the consumers. • Time for a Global Aerosol Information Network, GAIN ?