Download
1 / 24
250 likes | 508 Views
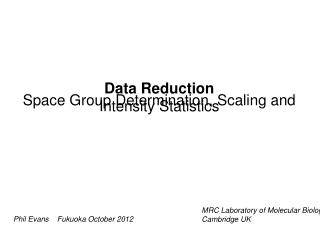
Earthquake scaling and statistics. The scaling of slip with length Stress drop Seismic moment Earthquake magnitude Magnitude statistics Fault statistics. The scaling of fault length and slip. Normalized slip profiles of normal faults of different length. From Dawers et al., 1993.

E N D
Earthquake scaling and statistics • The scaling of slip with length • Stress drop • Seismic moment • Earthquake magnitude • Magnitude statistics • Fault statistics
The scaling of fault length and slip Normalized slip profiles of normal faults of different length. From Dawers et al., 1993
The scaling of fault length and slip Displacement versus fault length What emerges from this data set is a linear scaling between displacement and fault length. Figure from: Schlische et al, 1996
The seismic moment The seismic moment is a physical quantity (as opposed to earthquake magnitude) that measures the strength of an earthquake. It is equal to: where: G is the shear modulus A = LxW is the rupture area D is the average co-seismic slip (It may be calculated from the amplitude spectra of the seismic waves.)
The scaling of seismic moment with rupture length • What emerges from this is that co-seismic stress drop is constant over a wide range of sizes. • The constancy of the stress drop implies linear scaling between co-seismic slip and rupture length. slope=3 Figure from: Schlische et al, 1996
Earthquake magnitude log(a) event1 event2 event3 distance Richter noticed that the vertical offset between every two curves is independent of the distance. Thus, one can measure the magnitude of a given event with respect to the magnitude of a reference event as: where A0 is the amplitude of the reference event and is the epicentral distance.
Earthquake magnitude • Richter arbitrarily chose a magnitude 0 event to be an earthquake that would show a maximum combined horizontal displacement of 1 micrometer on a seismogram recorded using a Wood-Anderson torsion seismometer 100 km from the earthquake epicenter. • Problems with Richter’s magnitude scale: • The Wood-Anderson seismograph is no longer in use and cannot record magnitudes greater than 6.8. • Local scale for South California, and therefore difficult to compare with other regions.
Earthquake magnitude • Several magnitude scales have been defined, but the most commonly used are: • Local magnitude (ML), commonly referred to as "Richter magnitude". • Surface-wave magnitude (MS). • Body-wave magnitude (mb). • Moment magnitude (Mw).
Earthquake magnitude • Both surface-wave and body-waves magnitudes are a function of the ratio between the displacement amplitude, A, and the dominant period, T, and are given by: • The moment magnitude is a function of the seismic moment, M0, as follows: • where M0 is in dyne-cm.
Earthquake magnitude The diagrams to the right show slip distribution inferred for several well studied quakes. It is interesting to compare the rupture area of a magnitude 7.3 (top) with that of a magnitude 5.6 (smallest one near the bottom).
Earthquake magnitude Magnitude classification (from the USGS): 0.0-3.0 : micro 3.0-3.9 : minor 4.0-4.9 : light 5.0-5.9 : moderate 6.0-6.9 : strong 7.0-7.9 : major 8.0 and greater : great
Intensity scale The intensity scale, often referred to as the Mercalli scale, quantifies the effects of an earthquake on the Earth’s surface, humans, objects of nature, and man-made structures on a scale of 1 through 12. (from Wikipedia) I shaking is felt by a few people V shaking is felt by almost everyone VIII cause great damage to poorly built structures XII total destruction
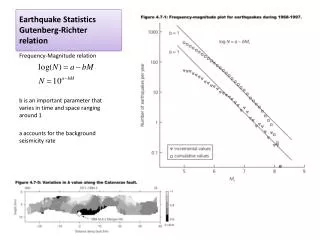
The Gutenberg-Richter statistics Fortunately, there are many more small quakes than large ones. The figure below shows the frequency of earthquakes as a function of their magnitude for a world-wide catalog during the year of 1995. This distribution may be fitted with: where n is the number of earthquakes whose magnitude is greater than M. This result is known as the Gutenberg-Richter relation. Figure from simscience.org
The Gutenberg-Richter statistics • While the a-value is a measure of earthquake productivity, the b-value is indicative of the ratio between large and small quakes. Both a and b are, therefore, important parameters in hazard analysis. Usually b is close to a unity. • Note that the G-R relation describes a power-law distribution.
The Gutenberg-Richter distribution versus characteristic distribution G-R distribution characteristic distribution • Two end-member models can explain the G-R statistics: • Each fault exhibits its own G-R distribution of earthquakes. • There is a power-law distribution of fault lengths, with each fault exhibiting a characteristic distribution.
Fault distribution and earthquake statistics Cumulative length distribution of subfaults of the San Andreas fault. Scholz, 1998
Fault distribution and earthquake statistics Loma Prieta
Fault distribution and earthquake statistics • In conclusion: • For a statistically meaningful population of faults, the distribution is often consistent with the G-R relation. • For a single fault, on the other hand, the size distribution is often characteristic. • Note that the extrapolation of the b-value inferred for small earthquakes may result in under-estimation of the actual hazard, if earthquake size-distribution is characteristic rather than power-law. Question: what gives rise to the drop-off in the small magnitude with respect to the G-R distribution?
The controls on rupture final dimensions Seismological observations show that: Co-seismic slip is very heterogeneous. Slip duration (rise time) at any given point is much shorter than the total rupture duration Example from the 2004 Northern Sumatra giant earthquake Preliminary result by Yagi. Uploaded from: www.ineter.gob.ni/geofisica/tsunami/com/20041226-indonesia/rupture.htm
The controls on rupture final dimensions • Barriers are areas of little slip in a single earthquake (Das and Aki, 1977). • Asperities are areas of large slip during a single earthquake (Kanamori and Stewart, 1978). The origin and behavior with time of barriers and asperities: Fault geometry - fixed in time and space? Stress heterogeneities - variable in time and space? Both?
The controls on rupture final dimensions According to the barrier model (Aki, 1984) maximum slip scales with barrier interval. If this was true, fault maps could be used to predict maximum earthquake magnitude in a given region.
The controls on rupture final dimensions But quite often barriers fail to stop the rupture… The 1992 Mw7.3 Landers (CA): The 2002 Mw7.9 Denali (Alaska): Figure from: pubs.usgs.gov Figure from: www.cisn.org
The controls on rupture final dimensions While in the barrier model ruptures stop on barriers and the bigger the rupture gets the bigger the barrier that is needed in order for it to stop, according to the asperity model (Kanamori and Steawart, 1978) earthquakes nucleate on asperities and big ruptures are those that nucleate on strong big asperities. That many ruptures nucleate far from areas of maximum slip is somewhat inconsistent with the asperity model.
The controls on rupture final dimensions • In the context of rate-state friction: • Asperities are areas of a-b<0. • Barriers are areas of a-b>0. Further reading: • Scholz, C. H., The mechanics of earthquakes and faulting, New-York: Cambridge Univ. Press., 439 p., 1990. • Aki, K., Asperities, barriers and characteristics of earthquakes, J. Geophys. Res., 89, 5867-5872, 1994.