Download
1 / 63
630 likes | 774 Views
Water Quality, Manure and Nutrient Management for Certified Livestock Manager Training. Rick Wilson, Ohio EPA July 10, 2008. Mandate to Restore Polluted Waters. FEDERAL WATER POLLUTION CONTROL ACT [As Amended Through P.L. 107–303, November 27, 2002].

E N D
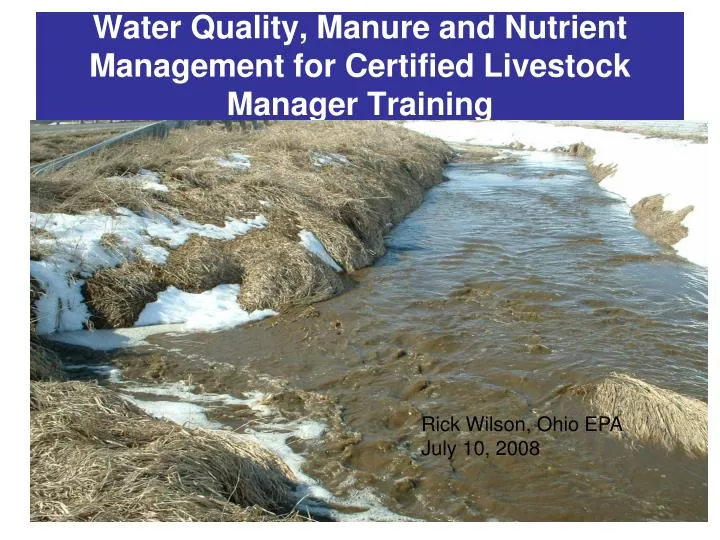
Water Quality, Manure and Nutrient Management for Certified Livestock Manager Training Rick Wilson, Ohio EPA July 10, 2008
Mandate to Restore Polluted Waters FEDERAL WATER POLLUTION CONTROL ACT [As Amended Through P.L. 107–303, November 27, 2002] SEC. 101. (a) The objective of this Act is to restore and maintain the chemical, physical, and biological integrity of the Nation’s waters.
Ohio EPA monitors water quality in Ohio and reports its findings. • Since the early 1970s, Ohio EPA has measured the quality of Ohio’s water resources and worked with industries, local governments, and citizens to restore the quality of substandard waters. • The Integrated Report is required by the federal Clean Water Act to fulfill two purposes: (1) to provide a summary of the status of the state's surface waters (2) to develop a list of waters that do not meet established goals—the "impaired waters.“ The 303(d) list • Under the Clean Water Act, once impaired waters are identified the state must take action to improve them. This includes developing restoration plans (total maximum daily loads (TMDLs), water quality based permits, and prioritizing funding nonpoint pollution control measures.
Leading Causes of Impairment2008 Integrated Report For watersheds, most impairments are related to modification of the landscape. These types of impairments have the most impact on smaller streams. Nearly all impaired watershed units (202 of 209) had at least one of these causes contributing to impairment and 65% (136 of 209) had three or more of the top five causes listed.
What’s Causing the Problems? Most aquatic life impairment is caused by land disturbances related to agriculture activities and urban development.
Hydromodification Examples: agricultural drainage systems, channelization LargeRivers– 38% SmallWaters– 49%
Silt & Sediment LargeRivers– 19% SmallWaters– 64% Examples: construction activities, tillage, andloss of riparian corridor and flood plains
Habitat Alteration Examples: low-head dams, removal of riparian trees LargeRivers – 44% Small Waters – 62%
Nutrients LargeRivers – 38% Small Waters – 61% Laundry list here, Agricultural runoff (dominant land use in Ohio)
Organic Enrichment & D.O. Examples: Domestic sewage and livestock manure discharges LargeRivers – 44% SmallWaters – 54%
9/12–14/05 25 20 D.O. mg/l 15 10 5 0 0 2000 4000 6000 8000 Time Gross Nutrient EnrichmentStillwater River
Habitat Destruction and Nutrient EnrichmentEffects on Stream Fish Community Degraded Fishery Healthy Fishery
Good Habitat(Shading, Better Nutrient Processing, More Living Places)
Poor Habitat(Full Sunlight, Boom and Bust Production, Fewer Living Spaces)
Buffers and Habitat Quality Bank erosion Nothing here to filter pollution
Managing the Landscape to Manage Nutrient Loads • Streams need wide buffers • provide shading • cooler temperature • limit algae growth • filter pollutants • allow sediment to drop out • vegetation take up nutrients • accidents do happen, need margin of safety • Good Physical Habitat • increase processing of nutrients • where drainage needed, consider natural channel design • Wetlands or Riparian for Tile Drainage • tiles by-pass riparian zone
Little or No Data Background Normal Enriched Polluted Average Phosphorus Concentrations Around Ohio
Nutrient Guidelines for Ecosystem Protection. Nutrient Water Quality Standards are currently under development.
BMPs and the Permits that Require them to be Implemented • Setbacks! • Tile Outlet checks! • Evaluate field for Soil Cracks! • Site specific areas of concern (concentrated flow paths) • Agronomic Utilization! (Keep Soil test P levels from skyrocketing) • Forecast! • Record keeping!
Know where your land application field drains, and monitor there.
Know where your land application field drains, and monitor there.
Forecast-London OH 7-8-08www.noaa.gov (Hourly Weather Graph)
Lake Erie-Western BasinResearch from Heidelberg College (Baker et al) • Past 33 years of data from Ohio Tributary Loading program has shown dissolved reactive phosphorus (DRP) loading decreased 65% through mid 1990s. Since then, DRP loads have increased rapidly and in 2007 reached historic highs. • The high bioavailability of DRP make it a prime suspect in the recurrence of harmful algal blooms within Lake Erie. • Excessive phosphorus loading identified as cause for increases in Blue-green algae (Microcystis). Photo by: Thomas Bridgeman, University of Toledo
Lake Erie-Western BasinResearch from Heidelberg College (Baker et al) • The increases in DRP loading are derived from cropland and are linked to changing fertilizer management associated with conservation tillage and to stratification in the soil column. • Storm water from cropland runoff entering southern shores of Lake Erie contain high concentrations of dissolved nutrients, including DRP and Nitrate. As sediments settle out of the water column, these nutrients are available to support algal growth Photo by: Thomas Bridgeman, University of Toledo
Dr. David Baker-Heidelberg CollegeNational Center For Water Quality Research Current farming methods that contribute to excessive dissolved phosphorus runoff include: 1. Phosphorus accumulation in the surface layers of soil, in the absence of tillage that inverts the soil. 2. Fall and winter surface applications of fertilizer and manure without incorporation. 3. Maintenance rather than draw-down applications of phosphorus fertilizers, where justified by soil tests.
Effect of Broadcast Manure on Runoff Phosphorus Concentrations over Successive Rainfall EventsPeter J.A. Kleinman and Andrew N. Sharpley (JEQ-2003) How does Manure Management fit into this Discussion? • Broadcast manure concentrates soluble P at the soil surface where it is readily available to runoff into water (Sharpley et al., 1984) • Of existing manure application methods, broadcasting generally results in the greatest potential for soluble P losses in runoff (Zhao et al., 2001)
Rain or snow melt Particulate phosphorus associated with eroded soil particles. Dissolved phosphorus picked up from soil solution. Surface Runoff Zone of runoff interaction - 1-5 cm. Infiltration and percolation Tile flow with nitrate How does phosphorus move from fields to streams? Under conservation tillage phosphorus accumulates at the soil surface. From Heidelberg College , NCWQR-Baker et al.
Detroit River 24.3 km3 water 287 mtons TP 15x more water Maumee River 1.56 km3 water 587 mtons TP 2x more phosphorus Baker et al, 2007
Western and Central Basins---Lake ErieSatellite Image, April 2, 2008Sagady & Associates, East Lansing, MI.
Agricultural Phosphorus and Eutrophication, Second Edition A.N. Sharpley, T. Daniel, T. Sims, J. Lemunyon, R. Stevens, and R. Parry United States Department of Agriculture Agricultural Research Service, ARS–149, September 2003
Injected manure • Soil saturation checked and recorded? • Rate based in consideration of all variables. • Remember manure application in these conditions, is still not considered a good practice. It’s marginal at best with regard to true nutrient utilization.
Evaluate each field for site specific issues (e.g. concentrated flow paths)
UT Tributary to Cessna Cr. @ Rd 90 March 1, 2007, 15:38 hrs. February 26, 2007, 12:25 hrs 3 days earlier
Downstream land where separated sand solids from Dairy Manure were land applied onto frozen /snow covered land February 26, 2007, 12:25 hrs March 1, 2007, 15:38 hrs.