Download
1 / 21
220 likes | 341 Views
Potential Sites for Transit-Oriented Development in San Diego. Katie Lemmon UP 206 A Final Project March 14, 2011. Policy Question. Where should SANDAG and the City of San Diego work together to prioritize transit-oriented development and what tools will help these agencies collaborate?.

E N D
Potential Sites for Transit-Oriented Development in San Diego Katie Lemmon UP 206 A Final Project March 14, 2011
Policy Question Where should SANDAG and the City of San Diego work together to prioritize transit-oriented development and what tools will help these agencies collaborate?
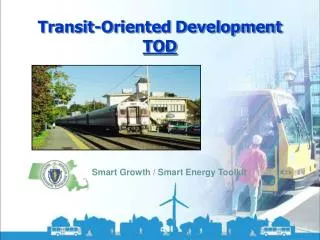
TOD Overview • Successful transit-oriented development (TOD) needs: • high density of people • access to transit and amenities • inhabitants who will actually take transit or non-car modes
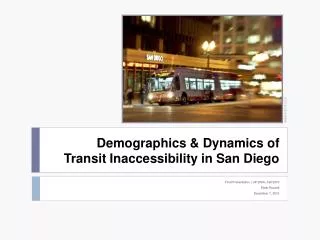
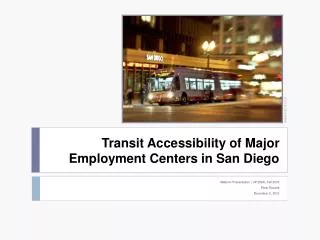
Goal • Identify areas with a high potential for successful TOD within ¼ mile of bus rapid transit and express bus stopsand routes (existing and proposed) • Create tool for inter-agency collaboration and data sharing • Bus rapid transit is one proposed solution to combat region-wide mobility issues in • San Diego Photo credit: Denis Desmond, MTS
Methodology • Identify express bus routes and stops in San Diego • Rank census tracts based on TOD demographics: • Population density – weighted 1 because it’s an important component of TOD • Workers who commute using alternatives to cars – weighted 2 because it is more important than density • Workers with no vehicles – weighted 2 because indicates transit need and is as • Within identified census tracts, create ¼ buffer around existing express bus stops and proposed rapid route • Identify redevelopment areas, if any • Identify online tools for collaboration
Ranking based on: • Population density • Alternative mode commuters • Workers with no vehicles • Selected Top 5 Highest Ranked Tracts
Ranking based on: • Population density • Alternative mode commuters • Workers with no vehicles
4 TOD tracts are within City’s redevelopment area • 1 TOD tract is not in redevelopment area and will not be considered for further study
Proposed Rapid Transit • SANDAG’s proposed Mid-City Rapid line • BRT route • One segment of an integrated regional network • Will connect to existing express route along I-15
Proposed Rapid Transit: Original Data • Metadata for Mid-City Rapid proposed route • Shapefile created by drawing bus route and stops • Based on image from www.keepsandiegomoving.com (SANDAG project website)
*Note: ¼ mile buffer around proposed route not just proposed stops because feeder routes stop and connect along proposed route
Combination of two buffers: • ¼ mile buffer around proposed route and • ¼ mile buffer around existing express bus stops
Google Mash Up: Real World Collaboration Tool Steps: • Create model to convert files to KMZ • Research for-sale parcels online as of 3/14/11 • Geocode for-sale parcels • Write html • Display layers on Google map • SANDAG and the City can share maps
Google Mash-Up: For Sale Properties Near Priority Parcels http://www.katielemmon.bol.ucla.edu/googlemashup/html
Skills • Aggregating attribute fields -- combined alternative means to work fields into one field • Inset map -- locating City of San Diego • Attribute sub-set selection – selected express bus routes and stops from dataset of all transit modes • Created index – selected and weighted three variables to create index of high-potential tracts for TOD • Buffering – ¼ mile radius around express bus stops • Geoprocessing – intersect tool to show areas within census tracts that are ¼ mile from express bus stops
Skills continued • Modeling – conversion tool to convert multiple layers to KMZ files • Metadata – created for original data • Original Data – created line shapefile for proposed bus route, created point shapefile for proposed bus stops • Measurement/Analysis – buffer, intersect, union and dissolve tools to identify solution to policy question • Google Mash-Up – wrote html file to include proposed route layer, priority area layer, geocoded for-sale properties • Seven Layers – layout of ¼ mile buffers around existing stops and proposed route has seven layers
Sources • SANDAG • SanGIS • UCLA MapShare • ESRI-TIGER • American Community Survey • US Census • Bing maps • Google maps