Download
1 / 15
150 likes | 160 Views
MPP CAPSTONE. EXAMPLES AND GUIDANCE 2019. STRONG VISUAL FIRST PAGE. INFORMATIVE FIRST PAGE. This project was intended for journal publication. Background, methodology, results and conclusion all on one abstract page. EXECUTIVE SUMMARIES. This was a unique, appealing summary format.

E N D
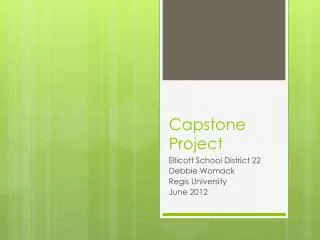
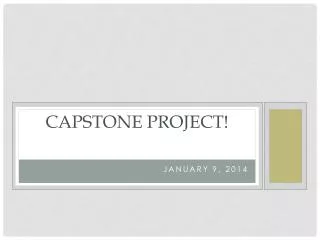
MPP CAPSTONE EXAMPLES AND GUIDANCE 2019
INFORMATIVE FIRST PAGE This project was intended for journal publication. Background, methodology, results and conclusion all on one abstract page.
EXECUTIVE SUMMARIES • This was a unique, appealing summary format. • An executive summary focuses busy people on the most • important findings, then they can decide if they want to read the • details. Reality is that policymakers won’t likely read long reports, • so this becomes necessary.
ANOTHER EXEC SUMMARY EXAMPLE • This style of summary helped the reader see the main findings, highlighted alongside a description of the paper’s sections.
ORGANIZATION Background – provide some history, context • A table of contents if helpful, though not required. Evaluation of potential policies and whether they have a record of success Examples from other jurisdictions Extrapolate from earlier analysis to design recommendations Make recommendations and conclude
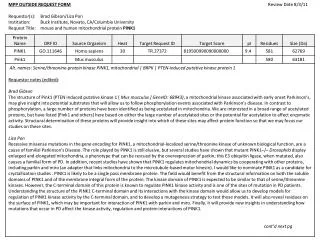
SUMMARIZE INFORMATION • You can use graphs and tables to summarize key details • Insert graphs and tables in the text using a consistent style throughout. Do not copy images from another publication unless it is impossible for you to recreate the graph yourself. Always cite these.
MATRICES HELP SUMMARIZE ANALYSIS • This one worked well in a PowerPoint presentation • This is a solid example of a matrix for print (in the paper)
PULLOUT QUOTES • Pullout quotes are a great way to highlight important details from complex data
ATTENTION-GETTING VISUALS • Striking photos can be used to demonstrate the severity of a policy issue or to compare before- and after- policy results
MAPS ARE A GREAT VISUAL FOR PATTERNS • This can be especially useful when a state/region is an outlier or when there are striking comparisons that highlight your policy analysis
MORE ON DATA… • If you choose to do a project with complicated statistical methods, work very closely with your faculty advisor(s) to ensure you fully understand the methods and conclusions you can make from such methods. And remember that it’s okay if you run your analysis and find that your hypothesis isn’t clearly justified.
TRY OUT SOME CREATIVE GRAPHICS • Infographsare a creative and easy to digest way to display concepts