Download
1 / 10
110 likes | 120 Views
Occidental Petroleum Overview. Jeff Bennett, President and General Manager – New Mexico Delaware Basin. June 27, 2017, New Mexico EnergyPlex Conference – Hobbs, New Mexico. Occidental in the Permian Basin/Highlights. Permian Basin Highlights 2016 Oil and Gas Performance. Permian Resources

E N D
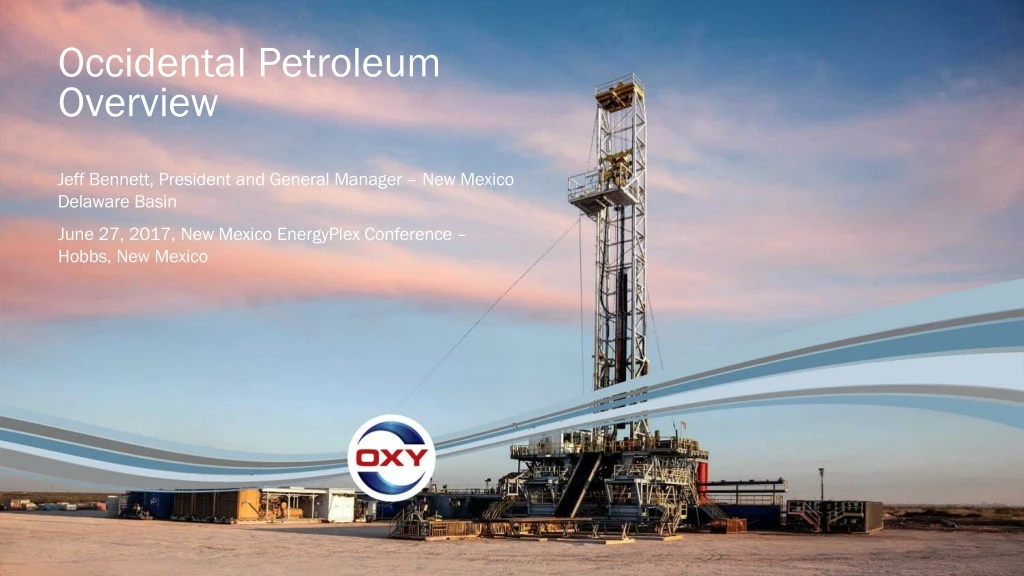
Occidental Petroleum Overview Jeff Bennett, President and General Manager – New Mexico Delaware Basin June 27, 2017, New Mexico EnergyPlex Conference – Hobbs, New Mexico
Permian Basin Highlights2016 Oil and Gas Performance Permian Resources Growth-oriented unconventional opportunities with approximately 1.4 million net acres Fastest-growing asset with over 11,650 drilling locations in its horizontal drilling inventory focused in Midland and Delaware basins; average lateral length increased 20% to approximately 7,100 feet Production averaged 124,000 BOE per day, a 13% increase from 2015 Reserve replacement rate of approximately 290%; finding and development costs at historic low of $9.00 per BOE Permian EOR Utilizes enhanced oil recovery techniques such as CO2 floods and waterfloods with approximately 1.1 million net acres Production averaged 145,000 BOE per day Nearly three-quarters of production comes from fields that actively employ CO2flooding Injects approximately 2.0 billion cubic feet of CO2per day into oil reservoirs, making Occidental the largest CO2 injector in the Permian Basin and among the largest globally
Permian Resources Focused Development • Contiguous Acreage • Multi-bench • Capable Infrastructure • Valuable Growth Greater Sand Dunes – 2,000+ Locations New Mexico NW Shelf Midland Basin NM Delaware Basin TX Delaware Basin Central Basin Platform Greater Barilla Draw – 5,000+ Locations Permian Resources Acreage Permian EOR Acreage
Permian Resources • New Mexico • Contiguous Acreage • Multi-bench • Capable Infrastructure • Valuable Growth New Mexico Business Plan… Range of Rig Count Annual Spend 3 Yr
Value Chain Partnerships Lower Costs • Logistic & Maintenance Hub Underway • Secures supply availability • $500 – $750k savings per well • Below market cost of supply will offset potential service cost inflation • Reduces last mile logistics costs • Mutually beneficial partnerships • Service company yard • Maintenance • Stimulation & Cement • Service directional tools • OCTG Laydown Yard • ~20 railcar spots • Dedicated truck entry/exit • Staging, returns, reclamation • Strategically located in New Mexico • 244 acres • 3 unit train loop • 30,000 tons of sand storage • Supports 10-12 rigs/year • Operational in early 2018 • Sand Transload and Storage • 6 Silos • 3 Unit train loops • Transload capacity • OxyChem Acid Facility • Transload, storage, and dilution of HCI for fracs • ~20 rail transload capacity
Proven Leader in Maximizing Recovery Across the Permian • Permian EOR • Significant inventory in 10-year plan • Geographically diverse • 100 active CO2 + water floods covering multiple horizons • 2 BBOE of identified net resource potential • 870 net MMBOE at • < $6.00 Future Development Cost Permian EOR Net Resource Potential MMBOE High-gradable Inventory Midland Basin Delaware Basin TZ/ROZ* Water Floods + Other Infill Drilling Opportunities Central Basin Platform CO2 Floods Permian EOR Acreage <$10 <$6 Future Development Cost ($/BOE) *Note: TZ/ROZ – Transition Zone and Residual Oil Zone
Permian EOR 2017 Capital Outlook CO2Floods / Expansions - $195MM TZ / ROZ Projects - $50MM Gas Processing Capacity - $50MM Water Flood and Infill Drilling - $30MM Non-operated + Maintenance - $135MM
Occidental Petroleum Forward-Looking Statements Portions of this presentation contain forward-looking statements and involve risks and uncertainties that could materially affect expected results of operations, liquidity, cash flows and business prospects. Actual results may differ from anticipated results, sometimes materially, and reported results should not be considered an indication of future performance. Factors that could cause results to differ include, but are not limited to: global commodity pricing fluctuations; supply and demand considerations for Occidental's products; higher-than-expected costs; the regulatory approval environment; reorganization or restructuring of Occidental's operations, not successfully completing, or any material delay of, field developments, expansion projects, capital expenditures, efficiency projects, acquisitions or dispositions; uncertainties about the estimated quantities of oil and natural gas reserves; lower-than-expected production from development projects or acquisitions; exploration risks; general economic slowdowns domestically or internationally; political conditions and events; liability under environmental regulations including remedial actions; litigation; disruption or interruption of production or manufacturing or facility damage due to accidents, chemical releases, labor unrest, weather, natural disasters, cyber attacks or insurgent activity; failure of risk management; changes in law or regulations; or changes in tax rates. Words such as “estimate,” “project,” “predict,” “will,” “would,” “should,” “could,” “may,” “might,” “anticipate,” “plan,” “intend,” “believe,” “expect,” “aim,” “goal,” “target,” “objective,” “likely” or similar expressions that convey the prospective nature of events or outcomes generally indicate forward-looking statements. You should not place undue reliance on these forward-looking statements, which speak only as of the date of this presentation. Unless legally required, Occidental does not undertake any obligation to update any forward looking statements, as a result of new information, future events or otherwise. Material risks that may affect Occidental’s results of operations and financial position appear in Part I, Item 1A “Risk Factors” of the 2016 Form 10-K.