Download
1 / 51
530 likes | 759 Views
GEOG 941 Climatology Seminar: Phenology and Climate Change. Introduction and Overview of Phenological Research. Research Contributions. Research Collaborators: R. Ahas, A. Aasa, X. Chen, B. Reed, M. White, and T. Zhao Phenology data from J. Caprio, DWD, and A. Menzel

E N D
GEOG 941 Climatology Seminar: Phenology and Climate Change Introduction and Overview of Phenological Research
Research Contributions • Research Collaborators: R. Ahas, A. Aasa, X. Chen, B. Reed, M. White, and T. Zhao • Phenology data from J. Caprio, DWD, and A. Menzel • Climate data from Chinese Meteorological Administration, German Weather Service (DWD), Instytut Meteorologii i Gospodarki Wodnej(Poland), and USA National Climatic Data Center • NSF Grants ATM-9510342, 9809460, and 0085224 • Base maps from ESRI data
Definition of Phenology • Phenologywhich is derived from the Greek word phaino meaning to show or to appear, is the study of plant and animal life cycle events, which are triggered by environmental changes, especially temperature. Thus, timings of phenological events are ideal indicators of global change impacts. • Seasonality is a related term, referring to similar non-biological events, such as timing of the fall formation and spring break-up of ice on fresh water lakes.
Phenological Research • Traditional approach: agriculture-centered, and local-scale events • Recent approach: Earth systems interactions, and global-scale events • Question: What roles for phenology in current and future research?
Decadal Averaged Cherry Bloom in Kyoto, Japan Data Source: web file (no longer available)
Mean onset of spring phenophases in the International Phenological Gardens (Europe) Source: Menzel et al. 2001, Global Change Biology, Figure 1
Cloned lilac first leaf and first bloom datesat a single station in Vermont
Simulated phenology developed from lilac and honeysuckle data combined with climate data Source: Schwartz and Reiter 2000, Plate 4 (updated)
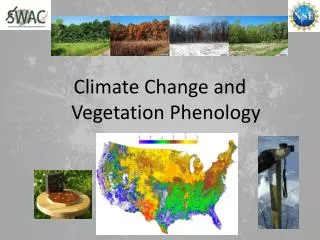
Critical Research Areas • Atmosphere-Biosphere Interactions • Long-term Organism response to Climate Change • Global Phenology Databases for monitoring and management
Integrated Approach • Satellite Observations (MODIS-NDVI/EVI) • Indicator Species Phenology • Native Species Phenology • Energy/Carbon Flux Measures
DMA NDVI Start of Season 1995(Schwartz et al. 2002, mean day = 74, March 15th)
Critical Research Areas • Atmosphere-Biosphere Interactions • Long-term Organism response to Climate Change • Global Phenology Databases for monitoring and management
Diurnal Range Change with Lilac First Leaf Source: Schwartz 1996, Figure 3
Critical Research Areas • Atmosphere-Biosphere Interactions • Long-term Organism response to Climate Change • Global Phenology Databases for monitoring and management
Terrestrial Biosphere Dynamic Change Detection • Satellite Phenology • Simulated Phenology (Models) • Cloned Species Phenology • Native Species Phenology
Satellite Phenology • Advantages: 1) Global coverage; 2) Integrated signal • Limitations: 1) Short period-of-record; 2) Cloud cover interference; 3) Interpretation issues; 4) Small set of measures
SMN NDVI Start of Season 1995 (Schwartz et al. 2002, mean day = 124, May 4th)
Simulated Phenology • Advantages: 1) Broad coverage if using simple input; 2) Standardized response • Limitations: 1) Model inadequacies; 2) Small set of events and plants
Spring Indices Suite of Measures • First -2.2oC freeze date in Autumn • Composite chill date (SI models) • First leaf date (SI models) • First bloom date (SI models) • Last -2.2oC freeze date in Spring • -2.2oC Freeze period • Damage index value (first leaf – last frost) • Average annual, average seasonal, and twelve average monthly temperatures
Cloned Species Phenology • Advantages: 1) Ideal for model development; 2) Standardized response to environment; 3) Broad range • Limitations: 1) Lack of network geographical coverage; 2) Not adapted to local environment
Native Species Phenology • Advantages: 1) Adapted to the local environment; 2) Precise signal • Limitations: 1) Lack of network geographical coverage; 2) Limited range; 3) Geographical variations in response
UW-M F. Station Native Species, 2000-2005(43.39oN, 88.02oW) • Fraxinus americana, white ash* • F. nigra, black ash • Hamamelis virginiana, witch-hazel* • Ilex verticillata, winterberry, black alder* • Larix laricina, tamarack • Ostrya virginiana, ironwood • Populus tremuloides, trembling aspen* • Prunus serotina, black cherry* • Quercus rubra, red oak* • Tilia americana, basswood • Ulmus americana, American elm • Viburnum lentago, nannyberry • Viburnum spp, maple-leaved viburnum • *= also observed at Harvard Forest • Acer saccharum, sugar maple* • Amelanchier spp, serviceberry, shadbush* • Betula alleghaniensis, yellow birch* • B. papyrifera, paper birch* • Carpinus caroliniana, musclewood • Carya cordiformis, yellowbud hickory • C. ovata, shagbark hickory • Cornus alternifolia, pagoda dogwood* • C. racemosa, grey dogwood • C. sericea, red osier dogwood • Crataegus spp, hawthorn* • Dirca palustris, leatherwood • Fagus grandifolia, American beech*
Integrated ApproachExample: WisconsinZhao and Schwartz (2003) • Satellite phenology (DMA SOS) • Simulated phenology (SI first bloom dates) • “Native” species phenology (WPS records of first bloom date for 21 introduced and 32 native species)
Critical Research Areas • Atmosphere-Biosphere Interactions • Long-term Organism response to Climate Change • Global Phenology Databases for monitoring and management
Critical Data/Analysis Needs • Interpretation/Comparison of satellite phenology with “spatially concentrated” surface data • Interpretation of “ripple effects” in biomes and managed systems • National, continental, and global scale phenology networks
ChEAS Phenology Project:Spatially Concentrated Phenological Measurements • Collect a spatially concentrated sample of tree phenology from a 600 x 600 m area in the vicinity of the WLEF tall tower (near Park Falls, WI @ 45.95oN, 90.27oW) • Collect associated microclimate, plant physiological, and leaf area measurements • Establish level of phenological variability as determined by environment and genetics, and gauge the impact on water flux
Uses of spatially concentrated phenological measures • Calibration and better understanding of remote sensing measurements • Improved accuracy of flux measurements scaled-up to larger areas • Improved accuracy of downscaling of regional scale atmospheric circulation models • Improved understanding of plant growth impacts on lower atmospheric processes • Improved understanding of connection between phenology and plant physiological processes
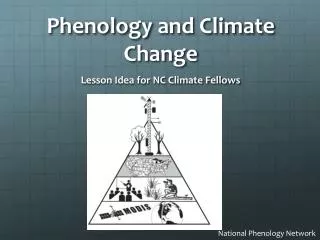
Vision of a USA National Phenology Network (NPN) • a continental-scale network observing regionally appropriate native (initially plant, but eventually insect and animal) species, cloned indicator plants (lilac + others), and selected agricultural crops • designed to complement remote sensing observations • data collected will be freely available to the research community and general public
What might be possible with 20 years (or less) of phenological data? • Facilitate understanding of plant phenological cycles and their relationship to climate • Comprehensive evaluation of satellite-derived measurements • Detection of long-term phenological trends in response to climate variability/global warming • Evaluate impacts of longer growing seasons on pollinators, cattle, crop and forest pests, wildfires, carbon storage, and water use