Download
1 / 19
190 likes | 191 Views
Get the latest update on the performance of the Asian Income Plus Strategy (Strategy II, USD) as of August 31, 2007. Analyze the return figures, currency holdings, top holdings, price performance, and more. Stay informed with this comprehensive report.

E N D
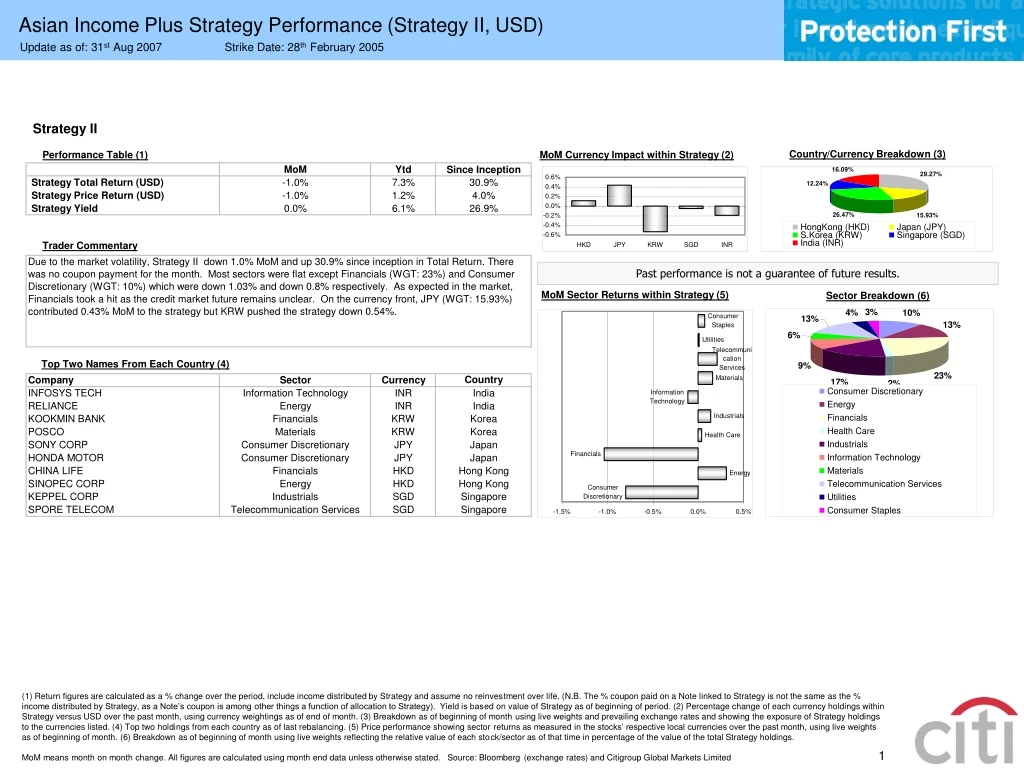
Asian Income Plus Strategy Performance (Strategy II, USD) Update as of: 31st Aug 2007 Strike Date: 28th February 2005 (1) Return figures are calculated as a % change over the period, include income distributed by Strategy and assume no reinvestment over life. (N.B. The % coupon paid on a Note linked to Strategy is not the same as the % income distributed by Strategy, as a Note’s coupon is among other things a function of allocation to Strategy). Yield is based on value of Strategy as of beginning of period. (2) Percentage change of each currency holdings within Strategy versus USD over the past month, using currency weightings as of end of month. (3) Breakdown as of beginning of month using live weights and prevailing exchange rates and showing the exposure of Strategy holdings to the currencies listed. (4) Top two holdings from each country as of last rebalancing. (5) Price performance showing sector returns as measured in the stocks’ respective local currencies over the past month, using live weights as of beginning of month. (6) Breakdown as of beginning of month using live weights reflecting the relative value of each stock/sector as of that time in percentage of the value of the total Strategy holdings. MoM means month on month change. All figures are calculated using month end data unless otherwise stated. Source: Bloomberg (exchange rates) and Citigroup Global Markets Limited
Asian Income Plus Note 1 Performance (Strategy II, USD) Update as of: 31st Aug 2007 Strike Date: 28th February 2005 Maturity Date: 11th March 2011 ISIN: XS0214048026 (i) Price as of respective month end as % of initial investment (ii) Price return and total return since Strike Date are calculated as a % change in price versus the Note Value at the beginning of the reference period and exclude any upfront fee but are net of all other fees. Total return figures include coupons paid and assume no reinvestment over life. (iii) Note Yield is calculated as the total coupon declared per Note during the period as a % of the value at the beginning of the period. % figures are not annualised. (iv) This is the USD amount paid to date per USD 10,000 denomination. (v) Strategy and CI monthly change are estimates and are calculated using beginning and end of month bid prices and allocations to Strategy. (vi) If the Gap measure rises above 25%, an “up-leverage” event will occur; a fall of the Gap measure below 15% would lead to “de-leverage” event. MoM means month on month change. Figures are calculated using month end data. Charts are based on month end data. Source: Bloomberg (exchange rates) and Citigroup Global Markets Limited
Asian Income Plus Note 2 Performance (Strategy II, USD) Update as of: 31st Aug 2007 Strike Date: 28th February 2005 Maturity Date: 11th March 2011 ISIN: XS0214047481 (i) Price as of respective month end as % of initial investment (ii) Price return and total return since Strike Date are calculated as a % change in price versus the Note Value at the beginning of the reference period and exclude any upfront fee but are net of all other fees. Total return figures include coupons paid and assume no reinvestment over life. (iii) Note Yield is calculated as the total coupon declared per Note during the period as a % of the value at the beginning of the period. % figures are not annualised. (iv) This is the USD amount paid to date per USD 10,000 denomination. (v) Strategy and CI monthly change are estimates and are calculated using beginning and end of month bid prices and allocations to Strategy. (vi) If the Gap measure rises above 25%, an “up-leverage” event will occur; a fall of the Gap measure below 15% would lead to “de-leverage” event. MoM means month on month change. Figures are calculated using month end data. Charts are based on month end data. Source: Bloomberg (exchange rates) and Citigroup Global Markets Limited
Asian Income Plus Note 4 Performance (Strategy II, USD) Update as of: 31st Aug 2007 Strike Date: 4th April 2005 Maturity Date: 15th April 2011 ISIN: XS0216477561 (i) Price as of respective month end as % of initial investment (ii) Price return and total return since Strike Date are calculated as a % change in price versus the Note Value at the beginning of the reference period and exclude any upfront fee but are net of all other fees. Total return figures include coupons paid and assume no reinvestment over life. (iii) Note Yield is calculated as the total coupon declared per Note during the period as a % of the value at the beginning of the period. % figures are not annualised. (iv) This is the USD amount paid to date per USD 10,000 denomination. (v) Strategy and CI monthly change are estimates and are calculated using beginning and end of month bid prices and allocations to Strategy. (vi) If the Gap measure rises above 25%, an “up-leverage” event will occur; a fall of the Gap measure below 15% would lead to “de-leverage” event. MoM means month on month change. Figures are calculated using month end data. Charts are based on month end data. Source: Bloomberg (exchange rates) and Citigroup Global Markets Limited
Asian Income Plus Strategy Performance (Strategy III, USD) Update as of: 31st Aug 2007 Strike Date: 28th February 2005 (1) Return figures are calculated as a % change over the period, include income distributed by Strategy and assume no reinvestment over life. (N.B. The % coupon paid on a Note linked to Strategy is not the same as the % income distributed by Strategy, as a Note’s coupon is among other things a function of allocation to Strategy). Yield is based on value of Strategy as of beginning of period. (2) Percentage change of each currency holdings within Strategy versus USD over the past month, using currency weightings as of end of month. (3) Breakdown as of beginning of month using live weights and prevailing exchange rates and showing the exposure of Strategy holdings to the currencies listed. (4) Top two holdings from each country as of last rebalancing. (5) Price performance showing sector returns as measured in the stocks’ respective local currencies over the past month, using live weights as of beginning of month. (6) Breakdown as of beginning of month using live weights reflecting the relative value of each stock/sector as of that time in percentage of the value of the total Strategy holdings. MoM means month on month change. All figures are calculated using month end data unless otherwise stated. Source: Bloomberg (exchange rates) and Citigroup Global Markets Limited
Asian Income Plus Note 3 Performance (Strategy III, USD) Update as of: 31st Aug 2007 Strike Date: 28th February 2005 Maturity Date: 11th March 2011 ISIN: XS0214047135 (i) Price as of respective month end as % of initial investment (ii) Price return and total return since Strike Date are calculated as a % change in price versus the Note Value at the beginning of the reference period and exclude any upfront fee but are net of all other fees. Total return figures include coupons paid and assume no reinvestment over life. (iii) Note Yield is calculated as the total coupon declared per Note during the period as a % of the value at the beginning of the period. % figures are not annualised. (iv) This is the USD amount paid to date per USD 10,000 denomination. (v) Strategy and CI monthly change are estimates and are calculated using beginning and end of month bid prices and allocations to Strategy. (vi) If the Gap measure rises above 25%, an “up-leverage” event will occur; a fall of the Gap measure below 15% would lead to “de-leverage” event. MoM means month on month change. Figures are calculated using month end data. Charts are based on month end data. Source: Bloomberg (exchange rates) and Citigroup Global Markets Limited
Asian Income Plus Strategy Performance (Strategy III, AUD) Update as of: 31st Aug 2007 Strike Date: 26th July 2005 (1) Return figures are calculated as a % change over the period, include income distributed by Strategy and assume no reinvestment over life. (N.B. The % coupon paid on a Note linked to Strategy is not the same as the % income distributed by Strategy, as a Note’s coupon is among other things a function of allocation to Strategy). Yield is based on value of Strategy as of beginning of period. (2) Percentage change of each currency holdings within Strategy versus AUD over the past month, using currency weightings as of end of month. (3) Breakdown as of beginning of month using live weights and prevailing exchange rates and showing the exposure of Strategy holdings to the currencies listed. (4) Top two holdings from each country as of last rebalancing. (5) Price performance showing sector returns as measured in the stocks’ respective local currencies over the past month, using live weights as of beginning of month. (6) Breakdown as of beginning of month using live weights reflecting the relative value of each stock/sector as of that time in percentage of the value of the total Strategy holdings. MoM means month on month change. All figures are calculated using month end data unless otherwise stated. Source: Bloomberg (exchange rates) and Citigroup Global Markets Limited
Asian Income Plus Note 6 Performance (Strategy III, AUD) Update as of: 31st Aug 2007 Strike Date: 26th July 2005 Maturity Date: 2nd August 2011 ISIN: XS0226091659 (i) Price as of respective month end as % of initial investment (ii) Price return and total return since Strike Date are calculated as a % change in price versus the Note Value at the beginning of the reference period and exclude any upfront fee but are net of all other fees. Total return figures include coupons paid and assume no reinvestment over life. (iii) Note Yield is calculated as the total coupon declared per Note during the period as a % of the value at the beginning of the period. % figures are not annualised. (iv) This is the AUD amount paid to date per AUD 10 denomination. (v) Strategy and CI monthly change are estimates and are calculated using beginning and end of month bid prices and allocations to Strategy. (vi) If the Gap measure rises above 18%, an “up-leverage” event will occur; a fall of the Gap measure below 12% would lead to “de-leverage” event. MoM means month on month change. Figures are calculated using month end data. Charts are based on month end data. Source: Bloomberg (exchange rates) and Citigroup Global Markets Limited
Asian Income Plus Strategy Performance (Pacific Real Estate Strategy, USD) Update as of: 31st Aug 2007 Strike Date: 6th June 2005 (1) Return figures are calculated as a % change over the period, include income distributed by Strategy and assume no reinvestment over life. (N.B. The % coupon paid on a Note linked to Strategy is not the same as the % income distributed by Strategy, as a Note’s coupon is among other things a function of allocation to Strategy). Yield is based on value of Strategy as of beginning of period. (2) Percentage change of each currency holdings within Strategy versus USD over the past month, using currency weightings as of end of month. (3) Breakdown as of beginning of month using live weights and prevailing exchange rates and showing the exposure of Strategy holdings to the currencies listed. (4) Top two holdings from each country as of last rebalancing. (5) Price performance showing sector returns as measured in the stocks’ respective local currencies over the past month, using live weights as of beginning of month. (6) Breakdown as of beginning of month using live weights reflecting the relative value of each stock/sector as of that time in percentage of the value of the total Strategy holdings. MoM means month on month change. All figures are calculated using month end data unless otherwise stated. Source: Bloomberg (exchange rates) and Citigroup Global Markets Limited
Asian Income Plus Note 5 Performance (Pacific Real Estate Strategy, USD) Update as of 31st Aug 2007 Strike Date: 6th June 2005 Maturity Date: 15th June 2011 ISIN: XS0221447237 (i) Price as of respective month end as % of initial investment (ii) Price return and total return since Strike Date are calculated as a % change in price versus the Note Value at the beginning of the reference period and exclude any upfront fee but are net of all other fees. Total return figures include coupons paid and assume no reinvestment over life. (iii) Note Yield is calculated as the total coupon declared per Note during the period as a % of the value at the beginning of the period. % figures are not annualised. (iv) This is the USD amount paid to date per USD 10,000 denomination. (v) Strategy and CI monthly change are estimates and are calculated using beginning and end of month bid prices and allocations to Strategy. (vi) If the Gap measure rises above 18%, an “up-leverage” event will occur; a fall of the Gap measure below 12% would lead to “de-leverage” event. MoM means month on month change. Figures are calculated using month end data. Charts are based on month end data. Source: Bloomberg (exchange rates) and Citigroup Global Markets Limited
Asian Income Plus Note 8 Performance (Pacific Real Estate Strategy, USD) Update as of: 31st Aug 2007 Strike Date: 13th April 2006 Maturity Date: 19th March 2012 ISIN: XS0251772314 (i) Price as of respective month end as % of initial investment (ii) Price return and total return since Strike Date are calculated as a % change in price versus the Note Value at the beginning of the reference period and exclude any upfront fee but are net of all other fees. Total return figures include coupons paid and assume no reinvestment over life. (iii) Note Yield is calculated as the total coupon declared per Note during the period as a % of the value at the beginning of the period. % figures are not annualised. (iv) This is the USD amount paid to date per USD 10,000 denomination. (v) Strategy and CI monthly change are estimates and are calculated using beginning and end of month bid prices and allocations to Strategy. (vi) If the Gap measure rises above 18%, an “up-leverage” event will occur; a fall of the Gap measure below 12% would lead to “de-leverage” event. MoM means month on month change. Figures are calculated using month end data. Charts are based on month end data. Source: Bloomberg (exchange rates) and Citigroup Global Markets Limited
Asian Income Plus Strategy Performance (China Strategy, USD) Update as of: 31st Aug 2007 Strike Date: 1st November 2006 (1) Return figures are calculated as a % change over the period, include income distributed by Strategy and assume no reinvestment over life. (N.B. The % coupon paid on a Note linked to Strategy is not the same as the % income distributed by Strategy, as a Note’s coupon is among other things a function of allocation to Strategy). Yield is based on value of Strategy as of beginning of period. (2) Percentage change of each currency holdings within Strategy versus USD over the past month, using currency weightings as of end of month. (3) Breakdown as of beginning of month using live weights and prevailing exchange rates and showing the exposure of Strategy holdings to the currencies listed. (4) Top two holdings from each country as of last rebalancing. (5) Price performance showing sector returns as measured in the stocks’ respective local currencies over the past month, using live weights as of beginning of month. (6) Breakdown as of beginning of month using live weights reflecting the relative value of each stock/sector as of that time in percentage of the value of the total Strategy holdings. MoM means month on month change. All figures are calculated using month end data unless otherwise stated. Source: Bloomberg (exchange rates) and Citigroup Global Markets Limited
Asian Income Plus Note 10 Performance (China Strategy, USD) Update as of: 31st Aug 2007 Strike Date: 1st November 2006 Maturity Date: 14th May 2010 ISIN: XS0274406577 (i) Price as of respective month end as % of initial investment (ii) Price return and total return since Strike Date are calculated as a % change in price versus the Note Value at the beginning of the reference period and exclude any upfront fee but are net of all other fees. Total return figures include coupons paid and assume no reinvestment over life. (iii) Note Yield is calculated as the total coupon declared per Note during the period as a % of the value at the beginning of the period. % figures are not annualised. (iv) This is the USD amount paid to date per USD 10,000 denomination. (v) Strategy and CI monthly change are estimates and are calculated using beginning and end of month bid prices and allocations to Strategy. (vi) If the Gap measure rises above 18%, an “up-leverage” event will occur; a fall of the Gap measure below 12% would lead to “de-leverage” event. MoM means month on month change. Figures are calculated using month end data. Charts are based on month end data. Source: Bloomberg (exchange rates) and Citigroup Global Markets Limited
Asian Income Plus Note 11 Performance (China Strategy, USD) Update as of: 31st Aug 2007 Strike Date: 1st November 2006 Maturity Date: 14th May 2010 ISIN: XS0274470235 (i) Price as of respective month end as % of initial investment (ii) Price return and total return since Strike Date are calculated as a % change in price versus the Note Value at the beginning of the reference period and exclude any upfront fee but are net of all other fees. Total return figures include coupons paid and assume no reinvestment over life. (iii) Note Yield is calculated as the total coupon declared per Note during the period as a % of the value at the beginning of the period. % figures are not annualised. (iv) This is the USD amount paid to date per USD 10,000 denomination. (v) Strategy and CI monthly change are estimates and are calculated using beginning and end of month bid prices and allocations to Strategy. (vi) If the Gap measure rises above 18%, an “up-leverage” event will occur; a fall of the Gap measure below 12% would lead to “de-leverage” event. MoM means month on month change. Figures are calculated using month end data. Charts are based on month end data. Source: Bloomberg (exchange rates) and Citigroup Global Markets Limited
Asian Income Plus Note 12 Performance (China Strategy, USD) Update as of: 31st Aug 2007 Strike Date: 16th November 2006 Maturity Date: 1st June 2010 ISIN: XS0276010732 (i) Price as of respective month end as % of initial investment (ii) Price return and total return since Strike Date are calculated as a % change in price versus the Note Value at the beginning of the reference period and exclude any upfront fee but are net of all other fees. Total return figures include coupons paid and assume no reinvestment over life. (iii) Note Yield is calculated as the total coupon declared per Note during the period as a % of the value at the beginning of the period. % figures are not annualised. (iv) This is the USD amount paid to date per USD 10,000 denomination. (v) Strategy and CI monthly change are estimates and are calculated using beginning and end of month bid prices and allocations to Strategy. (vi) If the Gap measure rises above 18%, an “up-leverage” event will occur; a fall of the Gap measure below 12% would lead to “de-leverage” event. MoM means month on month change. Figures are calculated using month end data. Charts are based on month end data. Source: Bloomberg (exchange rates) and Citigroup Global Markets Limited
Vietnam Tracker Notes - Series 1 (USD) Update as of: 31st Aug 2007 Strike Date: 3rd March 2007 Maturity Date: 16th March 2010 ISIN: XS0291664471 (i) Price as of respective month end as % of initial investment (ii) Price return and total return since Strike Date are calculated as a % change in price versus the Note Value at the beginning of the reference period and exclude any upfront fee but are net of all other fees. Total return figures include coupons paid and assume no reinvestment over life. (iii) Note Yield is calculated as the total coupon declared per Note during the period as a % of the value at the beginning of the period. % figures are not annualised. (iv) This is the USD amount paid to date per USD 10,000 denomination. (v) Strategy and CI monthly change are estimates and are calculated using beginning and end of month bid prices and allocations to Strategy. (vi) If the Gap measure rises above 18%, an “up-leverage” event will occur; a fall of the Gap measure below 12% would lead to “de-leverage” event. MoM means month on month change. Figures are calculated using month end data. Charts are based on month end data. Source: Bloomberg (exchange rates) and Citigroup Global Markets Limited
Vietnam Tracker Notes - Series 2 (USD) Update as of: 31st Aug 2007 Strike Date: 22nd March 2007 Maturity Date: 16th March 2010 ISIN: XS0294294219 (i) Price as of respective month end as % of initial investment (ii) Price return and total return since Strike Date are calculated as a % change in price versus the Note Value at the beginning of the reference period and exclude any upfront fee but are net of all other fees. Total return figures include coupons paid and assume no reinvestment over life. (iii) Note Yield is calculated as the total coupon declared per Note during the period as a % of the value at the beginning of the period. % figures are not annualised. (iv) This is the USD amount paid to date per USD 10,000 denomination. (v) Strategy and CI monthly change are estimates and are calculated using beginning and end of month bid prices and allocations to Strategy. (vi) If the Gap measure rises above 18%, an “up-leverage” event will occur; a fall of the Gap measure below 12% would lead to “de-leverage” event. MoM means month on month change. Figures are calculated using month end data. Charts are based on month end data. Source: Bloomberg (exchange rates) and Citigroup Global Markets Limited
Vietnam Tracker Notes - Series 3 (USD) Update as of: 31st Aug 2007 Strike Date: 27th March 2007 Maturity Date: 16th March 2010 ISIN: XS0294486047 (i) Price as of respective month end as % of initial investment (ii) Price return and total return since Strike Date are calculated as a % change in price versus the Note Value at the beginning of the reference period and exclude any upfront fee but are net of all other fees. Total return figures include coupons paid and assume no reinvestment over life. (iii) Note Yield is calculated as the total coupon declared per Note during the period as a % of the value at the beginning of the period. % figures are not annualised. (iv) This is the USD amount paid to date per USD 10,000 denomination. (v) Strategy and CI monthly change are estimates and are calculated using beginning and end of month bid prices and allocations to Strategy. (vi) If the Gap measure rises above 18%, an “up-leverage” event will occur; a fall of the Gap measure below 12% would lead to “de-leverage” event. MoM means month on month change. Figures are calculated using month end data. Charts are based on month end data. Source: Bloomberg (exchange rates) and Citigroup Global Markets Limited
Disclaimer This communication is provided for information and discussion purposes only. In Hong Kong this communication is distributed by Citigroup Global Markets Asia Limited which is licensed under the Securities and Futures Ordinance (Cap. 571) of Hong Kong for dealing in securities, advising on securities, advising on corporate finance and providing automated trading services. The material contained in this communication does not constitute a recommendation or an offer to sell or a solicitation to buy any financial product. This material (together with any translation of it) provides alternatives we believe to be appropriate for your consideration. The decision whether or not to adopt any strategy or engage in any transaction is your responsibility. Some of the strategies discussed in this material may involve the use of exchange-listed options. Before entering into any transaction using such contracts, clients who are United States persons should read and understand the current options clearing corporation disclosure document (Characteristics and Risk of Standard Options), a copy of which may be obtained from us upon request. Information contained herein may relate to matters that are not regulated by the United Kingdom’s Financial Services Authority (FSA) or subject to the protections of the United Kingdom’s Financial Services and Markets Act 2000 and/or the United Kingdom’s Financial Services Compensation Scheme. This material (together with any translation of it) is provided on the understanding that (i) you are not relying on us or any of our affiliates for advice or recommendations of any kind, (ii) we are not managing your account neither do we have any powers over your accounts, (iii) you have sufficient knowledge and experience to be able to understand the financial products discussed and any risks (direct or indirect) associated with investing in them as well as any legal, tax, accounting or other material considerations and (iv) you are not relying on any translation of this communication or any other translated materials that may have been prepared by us for your ease of reference. Any translation of this communication merely provides in summary a translation for your ease of reference and we make no representation as to the accuracy or completeness of any translation of this communication. Any translation of this communication shall at all times be subject to the terms and conditions set forth in this communication and the definitive terms set out in the final documents relating to any transaction you may enter into in respect of the purchase or sale of the financial products described herein. In the event of any discrepancy between the English language version of this communication and any translation of it, the English version shall prevail. If you believe you need assistance in evaluating and understanding any of these you should consult appropriate advisers before entering into a transaction. Where you are acting as an adviser or agent, you should evaluate this communication in light of the circumstances applicable to your principal and the scope of your authority. No liability whatsoever is accepted for any loss arising (whether direct or consequential) from any use of the information contained in this communication. On occasion information provided might include extracts or summary material derived from research reports published by our research department. You are directed to the original piece of research to see the research analyst’s full analysis. Any prices used herein, other than in relation to term sheets, are indicative. Although all information has been obtained from and is based upon sources believed to be reliable it may be incomplete or condensed and its accuracy cannot be guaranteed. Any opinions attributed to Citigroup constitute our judgment as of the date of the material and are subject to change without notice. Provision of information may cease at any time without reason or notice being given. Commissions and other transaction costs may not have been taken into consideration. Any scenario analysis is provided for illustrative purposes only and does not represent actual termination or unwind prices, nor does it present all possible outcomes or describe all factors that may affect the value of your investment. Past performance is not indicative of future performance. The transactions discussed may be subject to the risk of loss, meaning you may lose some or all of your investment especially where changes in the value of the transaction are accentuated by leverage. Even where the financial product is principal protected, there is a risk that any failure by a counterparty to perform obligations when due may result in the loss of all or part of your investment. We and/or our affiliates may, from time to time, have a long or short proprietary positions and/or actively trade, by making markets to our clients, in financial products identical to or economically related to those financial products covered in this material. We may also undertake hedging transactions related to the initiation or termination of a transaction, that may adversely affect the market price, rate, index or other market factors(s) underlying the financial product and consequently its value. We may have an investment banking or other commercial relationship with and access to information from the issuer(s) of securities, financial products, or other interests underlying a transaction. Any decision to purchase the financial product described should be based upon the information contained in any offering document produced in connection with this communication. The information contained herein is therefore qualified in its entirety by such offering document. In the case of an offering document with a section headed “Investment Considerations” or equivalent, please refer to that section for a discussion of certain factors to be considered in connection with an investment in the financial product described herein. No liability whatsoever is accepted for any loss arising (whether direct or consequential) from any use of the information contained in this communication. Any financial product described herein have not been and will not be registered under the United States Securities Act of 1933 or any United States securities law, and may not be offered or sold within the United States or to, or for the account or benefit of, any United States person, except pursuant to an exemption from, or in a transaction not subject to, the registration requirements of the United States Securities Act of 1933. The financial product described herein have not been authorised for public sale in any other country, state or jurisdiction. By the purchase of the financial product described herein, you will be deemed to have agreed to not make any offers to on-sell, to solicit any offer, to buy, or to on-sell any such product in any jurisdiction in a way that would constitute an offer or sale, or invitation for subscription or purchase, of such product to the public in that jurisdiction. Notwithstanding any other provision, it is hereby agreed that the U.S. tax treatment and the U.S. tax structure of the transaction and all materials of any kind (including opinions or other tax analyses) that are provided relating to such U.S. tax treatment and U.S. tax structure, may be disclosed to any and all persons, without limitation of any kind, other than any information for which nondisclosure is reasonably necessary in order to comply with applicable laws.