Download
1 / 12
120 likes | 211 Views
Under 15 and/or Institutionalized (5.3 million). Unemployment rate = # of unemployed labor force. X 100. Not in labor force (9.3 million). Unemployment rate = 1.4 million

E N D
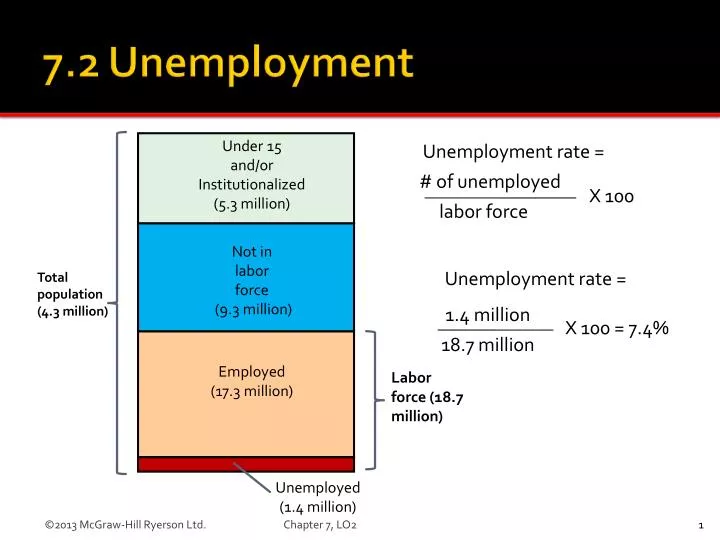
Under 15 and/or Institutionalized (5.3 million) Unemployment rate = # of unemployed labor force X 100 Not in labor force (9.3 million) Unemployment rate = 1.4 million 18.7 million Total population (4.3 million) X 100 = 7.4% Employed (17.3 million) Labor force (18.7 million) Unemployed (1.4 million) Chapter 7, LO2 LO2
How the unemployment rate is understated: • Part-Time Employment Statistics • Discouraged Workers Chapter 7, LO2
Frictional Unemployment • caused by workers voluntarily changing jobs and by temporary layoffs; unemployed workers between jobs • Structural Unemployment • caused by Changes over time in consumer demand and in technology alter the “structure” of the total demand for labour, both occupationally and geographically • Cyclical Unemployment • caused by a decline in total spending (or by insufficient aggregate demand) • Seasonal Unemployment • caused by seasonal factors Chapter 7, LO2
Natural rate of unemployment (NRU) • NOT zero unemployment • Occurs when there is no cyclical unemployment • Not automatic • Varies over time Chapter 7, LO2
GDP Gap • GDP gap = actual GDP – potential GDP • Can be negative or positive • Okun’s Law • Every 1% of cyclical unemployment creates a 2% GDP gap Chapter 7, LO2
Economic Costs of Unemployment • Given for 2009: • Unemployment rate is 8.3% • Natural rate is 6.5% • Potential GDP is $1360 billion • What is the GDP gap? • 8.3% 6.5% = 1.8% (gap in % terms) • 1.8% X 2 = 3.6% (apply Okun’s Law) • 3.6% of $1360 billion = $49 billion Chapter 7, LO2
Economic Costs of Unemployment • Unequal Burdens • Occupation • Age • Gender • Education Chapter 7, LO2
Unemployment means idleness • Increases poverty, heightens racial and ethnic tensions, and reduces hope for material advancement • Severe unemployment can lead to rapid and violent social and political change • higher unemployment linked to increases in suicide, homicide, and physical and mental illness Chapter 7, LO2