Download
1 / 91
910 likes | 919 Views
Crash Data Collection and Quality. Why collect/maintain safety data?. Khisty says: Is that all? Better understanding of operational problems Accurate diagnosis of crash problems Develop remedial measures Evaluate the effectiveness of road safety programs. Who uses crash data?.

E N D
Why collect/maintain safety data? • Khisty says: • Is that all? • Better understanding of operational problems • Accurate diagnosis of crash problems • Develop remedial measures • Evaluate the effectiveness of road safety programs
Who uses crash data? Road safety educators To ensure that their efforts well targeted Safety administrators Report statistical information on road crashes Researchers Access good reliable database Vehicle manufacturers Assess the safety of their products • Road safety engineers • Develop remedial measures • Police • Charging a person at fault in crash • Enforcement activities • Location of speed cameras • Breath testing stations • Insurers • Seeking facts before settling claims • Lawyers • Compensation for injuries Importance of good data (Video “L”)
And, for Commercial Motor Carriers … • Identifying the appropriate Commercial Motor Carrier • Determining Reportable Crashes • Identifying Vehicle Configuration and Cargo Body Type • Determining Sequence of Events • Recording Hazardous Materials • Recording proper CDL
Supplementary data sources (Ogden) • While police crash report is the basic source of crash data, there are some other sources which may be useful and applicable in certain circumstances • Local knowledge • Local government staff • Emergency service personnel • Local safety groups • Local businesses • Interview of road users • People involved in a crash at a site of interest, which are source of useful information for traffic officials in development of countermeasures • In-depth studies of particular group of crashes • Single vehicle fatal crashes, to gain better understanding of the nature of those crashes
Supplementary data sources (continued) • Traffic conflict surveys • May be used when the collection of crash data is not practical or period of evaluation is too short to collect sufficient samples • Field observation • Video recording of conflicts • Information gained in this way is valuable in • getting a sound understanding of the traffic operation • Find interactions between traffic streams at the site • As a proxy measure of safety • Assumption must be made about relationship between proxy measure (conflict) and crash rates • Site investigations are necessary component of a countermeasure development program
What is reportable? • In most US states, the five point scale often referred to as KABCO • K person with fatal injury • A person with incapacitating injury • B person with non-incapacitating evident injury • C person with possible injury • O no injury (property damage only) • Some countries report injury crashes only • Some states do not differentiate between injury types • Implication? • Some crashes are not reported … why? • Many states use a reporting “threshold” • May vary even within states … implication?
In-class exercise Crash form elements and the Haddon Matrix
Storage/retrieval • <500 annually may be filed (paper) with summary tables • Increasingly, all data are input into a database (and forms scanned) • Feeds state and national databases
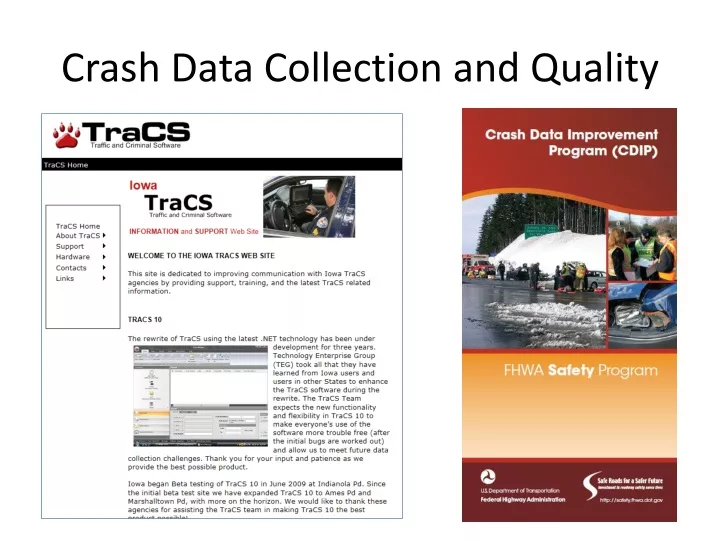
Data Collection Technologies • TraCS: Traffic and Criminal Software
Easy Street Draw & Visio Florida TraCS show
Case study – access management From … Use and Abuse of Crash Data in Roadway Access Management A Workshop at the National Access Management Conference Baltimore, Maryland July 13, 2008
Data-Driven Access Management • Access management treatments and plans should be directly tied to measurable objectives such as crash or crash cost reduction • Access management treatments proposed should be appropriate given the types of crashes and pattern of crashes being experienced in a corridor • Access management treatment costs need to be justifiable based upon the expected benefits of crash reductions and other objectives • Stakeholders and decision-makers must be convinced that the “gain” of access management is worth the “pain” • Confidence in both past (“before treatment”) and expected future crash rates (“after treatment”) should be high • You want to be very sure that any treatments will produce a noticeable and positive result
Access Management and Safety • Most access-management related crashes occur on urban and suburban arterial roadways at speeds of 35 to 55 miles per hour • Up to half of all crashes in urban areas are related to issues of access (minor public road intersections, traffic signal spacing, driveways) • Although most access-related crashes occur in urban or suburban areas, access-related crashes in rural areas tend to be severe crashes due to higher travel speeds • Access-related crashes occur at conflict points • The diagram represents one crash data point
What’s On Your Table … Traffic over time Crash data tables and charts Corridor photos Land Use 34 Laminated base map Crash data stack map
Crash Data Allow Better … • Problem Identification • Understanding of the problem before jumping into exploring and designing solutions • Focus on severe crashes rather than all (minor) crashes However …
You Need Good Quality Data The Ingredients Matter: Quality Control
Crash Data Quality: Timeliness • Sometimes crash data are not available for months or even years • Varying timeliness of different jurisdictions can cause issues for comparative analysis • Time itself is important – did something change during the analysis period? • Also – the time period is important … one year of data are probably not enough!
Crash Data Quality: Accuracy Considering functional area Original • Spatial Location • Attributes, e.g., severity, crash type, roadway info 1ST Road SOUTH ANKENY BOULEVARD v
Crash Data Quality: Completeness • Missing data can lead to a misleading picture and erroneous conclusions • Some crash records have “unknown” or “other” fields • Some crash records are missing altogether • Variations between jurisdictions (county level, state level) can lead to inaccuracies in comparative analysis • Random bias - Under-reporting can result in distorted picture of road crash situation
Crash Data Quality: Consistency/Uniformity • Across jurisdictions • Across time • Consistent severities • Discontinuities • Data from one time period can not be compared to another time period
MMUCC and MIREModel Minimum Uniform Crash CriteriaModel Inventory of Roadway Elements Crash Vehicle Person Roadway
Consistency • Although the need for data is universally recognized, there is little consistency in collected data (Ogden) • Comparative study of eleven European countries found that • Only two variables (date & hour) were collected in all eleven countries • 7 percent of items were recorded in three countries • 70 percent recorded in only one country • There is no nationwide crash data reporting system in US • Little consistency within states for recorded data elements
Crash Data Quality: Integration • Integration provides a ‘richer’, more complete source of information (e.g., integration with roadway features) • Double check on accuracy (including severity) • Privacy is a tough issue • Another tough issue is multiple offices and even agencies being in charge of various parts of safety data
Crash Data Quality: Accessibility • How can you get crash data? • How easy is it to get? • What form do you want it in? • Liability and perception is an issue. • Continuum: not available … special request w/delay … regular updates … service … instant web access
Typical Crash Data IssuesThese may not be apparent to the data user
Changes in Crash Forms Collision Type Before After • Content • Addition/elimination of attributes collected • Change in definitions (values)
Changes in Crash Forms, cont. Change in crash form Crash Rate Crash Rate Year Year Statewide Site #1 Impacts: Difficult to perform direct comparisons over analysis period. May result in systematic change in apparent crash performance, e.g. crash reduction.