Download
1 / 22
220 likes | 359 Views
PECULIARITIES IN DISTRIBUTION OF THE N:P RATIO IN SEAWATER OF THE JAPAN/EAST SEA. P . Tishchenko, V.Lobanov , A.Nedashkovskiy, G.Pavlova, S.Sagalaev , M.Shvetsova V.Il’ichev Pacific Oceanological Institute, Vladivostok, Russia and L.Talley

E N D
PECULIARITIES IN DISTRIBUTION OF THE N:P RATIO IN SEAWATER OF THE JAPAN/EAST SEA P. Tishchenko, V.Lobanov, A.Nedashkovskiy, G.Pavlova, S.Sagalaev, M.Shvetsova V.Il’ichev Pacific Oceanological Institute, Vladivostok, Russia and L.Talley Scripps Institution of Oceanography, San Diego, USA • Some Results Submitted to the Russian Journal “Oceanologiya”
Objectives: to specify processes which govern peculiarity in distribution of N:P ratios in the Japan/East Sea • Main results: • Near surface and near bottom of the Sea, N:P ratios reveal low values (significantly less than the Redfield ratio) due to two suggested processes – photolysis and denitrification. • Within 50–80 m depths vertical distribution of the N:P ratios have maximum which exceed Redfield ratio as a rule. This maximum may be caused by photooxydation of dissolved organic matter by nitrate or result of phosphatescavenging by detritus formation. • Main body of the Sea is characterized by near constant N:P ration (12.65).
DATA 1. International cruises on aboard R/V Roger Revelle and Professor Khromov in summer1999; 2. R/V Akademik Lavrent’ev in October 2003. In 1999: CTD Dissolved oxygen Nutrients (nitrate, nitrite, phosphate and silicate) PH Alkalinity In 2003: CTD, TA, dissolved Ca, Mg and SO4 of pore water
Fig.1. Correlation dependence between concentration of inorganic forms of dissolved nitrogen ([NO3] + [NO2]) and phosphorus for waters of the Sea in summer 1999. (Yellow dots are experimental data. There are four distinct sites designated by green, blue, black and purple lines.
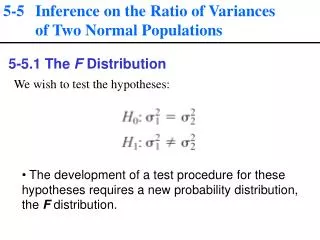
Two distinct views on the stoichiometric ratios of photosynthesis and remineralization exist currently : 1) considerable variation in the composition of organic matter. 2) relative constant stoichiometric ratios. (this view coresponds with the original Redfield ratio concept (Redfield et al., 1963) After N.Gruber and L.Sarmiento (1997; 2002) arguments, we accept here the second view. The soft tissue formation/remineralization represents in variations of nitrogen and phosphorous with constant ratio to each other DN:DP=16:1 (Redfield Ratio). Existence of deviations from RR may be caused by processes that have a distinctly different stoichiometry, such as nitrogen fixation and denitrification.
There are two approaches to distinguish nitrogen fixation and denitrification areas: b) Using of N/P- ratios. a) Using of N*-function (N*=N-16P+2.90; N.Gruber and L.Sarmiento, 2002) Fig.2. Vertical distribution of N* (a) and dN/dP (b). Existence of many negative deviations in N* which suggests that denitrifications is occurred in the Sea. However N/P reveal distinct different behavior in the upper layer of the Sea.
We suggest to use dN:dP ratios for distinguishing of nitrogen fixation and denitrification areas because these ratios have more clear sense. dN:dP ratios were obtained using empirical procedure, as following: Fig.2a. Vertical distribution of the dN:dP ratios demonstrates low ratios near surface waters, maximum which exceeds Redfieald ratio. Existence of many negative deviations in dN/dP between 500 -2000 m suggests that denitrifications is occurred in the Sea.
Fig.3. Vertical distribution of N* and dN/dP for some typical stations. Shapes of the N* and dN/dP are very similar for deep water but quite different for shallow water. Shallow waters reveal very low dN/dP rations which do not reflected in the N* profiles. We prefer dN/dP ratios for recognition of nitrogen fixation and denitrification processes than N* - function because dN/dP parameter has clear sense .
Most of N/Pvalues are lied between 0 and 6 for near surface water. Main reason of the low N:P ratio in shallow waters is photolysis of nitrate and nitrite ions under natural sunlight irradiation according to reactions (O.C.Zarfiru and M.B. True. 1979. Mar.Chem., V.8, p.9-42.; Y.Zuo and Y.Deng. 1998. Chemisphere, V.36, p.181-188; L.J.Spokes and P.S.Liss. 1996. Mar.Chem. V.54. p.1-10.): Fig.4. Distribution of dN/dP near surface waters of the Sea.
Natural surface seawater from the Japan/East Sea has undetectable level phosphate nitrate and nitrite was poisoned by HgCl2. 1 micromole of NO2- was added into 1 L of this water. Obtained solution was exposed under natural sunlight in Quartz flask, Pyrex flask and Dark flask. Results demonstrated on the Fig.5 suggest photolysis of nitrites with rate 0.075 umol/day (10 hours of sunlight per day). Fig.5. Time course of nitrite photolysis by sunlight in the surface Japan/East Sea water poisoned by HgCl2. 1- Quartz flask 2-Pyrex flask 3-Dark flask
Most of maximum values of dN/dPare lied between 16 and 20 within 50 and 80 m depths. • Apparently, there are three possible reasons appearance of maximum in the dN/dP values. • Nitrogen fixation by nitrogen fixer. • Photooxidation of dissolved organic matter by nitrate ions in the surface with forming of N-enriched organic matter which is consequently mineralize in deeper layers (50-80m). • Scavenging of phosphate by detritus formation . Fig.6. Distribution of maximum of dN/dP values (a) and depths (b) in the Sea.
Nitrogen fixers (Trichodesmium) are living at temperature higher than 20 C (Carpenter and Romans. 1991. Science, V.254, p.1356-1358). Northern part of the Sea has lower temperature. We did not find regional feature in the maximum of N:P ratios. On this reason nitrogen fixation by Cyanobacteria is unlikely responsible for existence of dN/dP maximum. Fig.7. Surface temperature of the Sea in summer 1999.
There are two distinct area with low dN/dP ratios near bottom: • in Ulleung Basin, near Korean Strait • In northern part of the Sea, near Tartar Strait. Fig.8. Near-bottom distribution of N/P ratio in Summer 1999.Depths less than 500m are filled by grey.
Distribution of Nitrogen/Phosphate ratio in the JES suggests that denitrification is occurred near bottom on interface – “reduced sediments/ oxygenated seawater”. It is may be schematically represented as follows: Geochemical and hydrochemical properties supported this conclusion are following below
Fig.9. Near-bottom distribution of hydrochemical parameters in summer 1999:oxygen (a); phosphate (b)DIC (C); pCO2 (d).Stars are locations of sediment cores. Lowest oxygen concentration have been detected in northern part of the Sea (46N Lat.), which has no seasonal variability.
Fig.10. Composition of pore waters: TA (a); dissolved Ca (b);dissolved Mg (C); dissolved SO4 (d).1- St.33 46o28.808’ N;139o0.294’E2- St.38 44o52.611’ N;137o10.388’E Thus, interface between reduced sediments and oxygenated is favorable conditions for denitrification processes. Data suggest sulfatereduction is occurred in the sediments:
Fig.11. Sections of oxygen, umol/kg (a) and DIC, mmol/kg (b) along near 131o E. Longitude at Summer1999. Near Korean Strait, along the continental slopebottom water is depleted by oxygen and enriched by DIC.
Fig.13. Sections of oxygen, umol/kg (a) and DIC, mmol/kg (b) along near 46o N. Latitude at Summer1999.
Western part of the section is Primorye continental slope. Fig.14. Sections of N/P ratio along near 46 o E in Summer 1999.
Summary: • The main water body of the Japan/East Sea has N:P ratio as low as 12.65 due to two processes: • Photolysis of nitrite and nitrate ions in the surface water. This process supported available publications and own experimental data as well. • b) Denitrification on interface “oxygenated seawater – reduced sediments”. There are strong geochemical evidences for denitrification into two distinct near bottom area, which are characterized by low oxygen content, high CO2 content and low dN/dP ratios. These are southwestern slope of Ulleung Basin and Continental slope of Primorye in northern part of the Sea. Maximum of dN/dP ratios was discovered in subsurface waters, within 50-80 meters depth. It was supposed, that this maximum may be formed by photooxydation DOM with participate nitrate or nitrite ions and scavenging phosphate by detritus which form at there depths.
Here was nice picture which I removed because too big file. Thank you for attention !