Download
1 / 9
90 likes | 215 Views
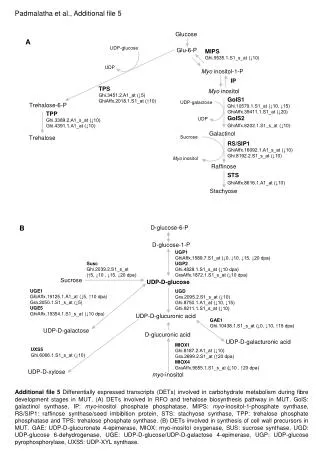
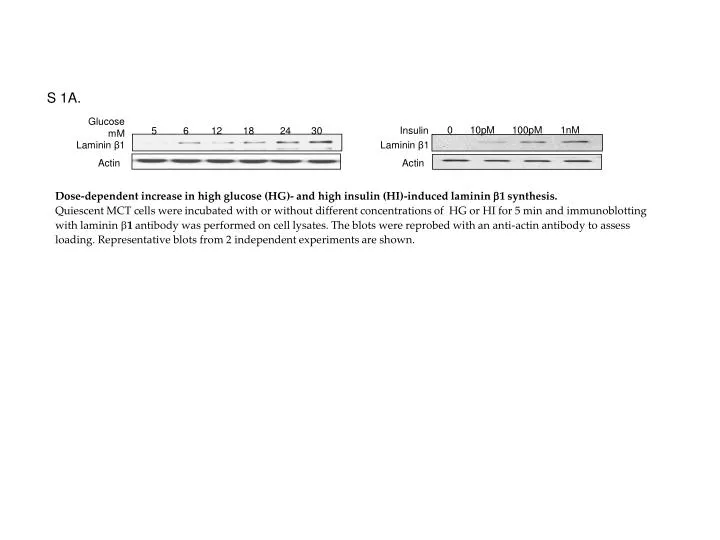
0. 10pM. 100pM. 1nM. 5. 6. 12. 18. 24. 30. Glucose mM. Insulin. Laminin β 1. Laminin β 1. Actin. Actin. S 1A. Dose-dependent increase in high glucose (HG)- and high insulin (HI)-induced laminin 1 synthesis.

E N D
0 10pM 100pM 1nM 5 6 12 18 24 30 Glucose mM Insulin Laminin β1 Laminin β1 Actin Actin S 1A. Dose-dependent increase in high glucose (HG)- and high insulin (HI)-induced laminin 1 synthesis. Quiescent MCT cells were incubated with or without different concentrations of HG or HI for 5 min and immunoblotting with laminin 1 antibody was performed on cell lysates. The blots were reprobed with an anti-actin antibody to assess loading. Representative blots from 2 independent experiments are shown.
Insulin (hr) Glucose (hr) Laminin β1 Laminin β1 Actin Actin 0 1 2 12 24 48 72 0 0 1 1 2 2 12 12 24 24 48 48 72 72 * * * * 1.2 1.00 1.0 0.8 0.75 Laminin/Actin 0.6 Laminin/Actin 0.50 0.4 0.2 0.25 0.0 0.00 72 0 1 2 12 24 48 Time in hours 0 1 2 12 24 48 72 Glucose+Insulin (hr) Laminin β1 Actin † † † 0.8 0.6 Laminin/Actin 0.4 0.2 0.0 0 1 2 12 24 48 72 Time in hours S 1B. Time in hours HG, HI and HG+HI stimulate laminin 1 synthesis for up to 48 hours. MCT cells were incubated with HG, HI or HG+HI for 60 min or for up to 72 hours. Immunoblotting with laminin 1 antibody was performed on cell lysates. The blots were reprobed with an anti-actin antibody to assess loading. Representative blots from 3 experiments are shown. Composite data from 3 experiments are shown in a graph; † p<0.01, *p<0.05 vs control by ANOVA.
Glucose min Fibronectin Actin Glucose min 0 5 10 15 30 60 0 5 10 15 30 60 0.6 Type IV Collagen 0.4 Fibronectin/Actin Actin 0.2 Insulin min 0.0 0 5 10 15 30 60 Type IV Collagen Time in minutes Insulin min Actin 0 5 10 15 30 60 0 5 10 15 30 60 Fibronectin Glucose+Insulin min Actin Type IV Collagen 0.6 Actin 0.4 Fibronectin/Actin 0.2 0.0 0 5 10 15 30 60 Time in minutes 0 5 10 15 30 60 0 5 10 15 30 60 Glucose+Insulin min Fibronectin Actin 0.6 0.4 Fibronectin/Actin 0.2 0.0 0 5 10 15 30 60 Time in minutes S 1C. HG, HI and their combination (HG+HI) do not induce synthesis of type IV collagen and fibronectin following incubation for up to 60 min. Western blotting was performed on cell lysates using an anti-collagen type IV antibody and anti-fibronectin antibody. The lower panels show blots reprobed with anti-actin antibody to assess loading. Representative blots from 2 experiments are shown for type IV collagen. Histogram shows composite data from 3 experiments for fibronectin and the changes were not found to be significant.
† * 120 80 [35S] labelled laminin β1 (% of control) 40 0 0 5 10 15 30 60 Glucose (min) * * 150 100 [35S] labelled laminin β1 (% of control) 50 0 0 5 10 15 30 60 Insulin (min) ‡ ‡ 120 80 [35S] labelled laminin β1 (% of control) 40 0 0 5 10 15 30 60 Glucose+Insulin (min) S 1D. HG, HI and their combination (HG+HI) increase synthesis of laminin β1 as evident by 35S labelling studies. Quiescent MCT cells were pre-incubated with [35S]-methionine for 2 hours prior to incubation with HG or HI. Equal amounts of protein from each group was immunoprecipitated using anti-laminin 1 antibody. The protein coupled to protein A agarose beads were separated by boiling with sample buffer lacking bromophenol blue and centrifuged. The supernatants were spotted on 3mm filter paper for determining radioactivity. Composite data from 3 experiments are shown in a graph; ‡ p<0.001, †p<0.01, *p<0.05 vs control by ANOVA.
0 5 10 15 30 60 Glucose min Insulin min Laminin β1 Laminin β1 0 5 10 15 30 60 Actin Actin * † * * 1.00 0.6 0.75 0.4 0.50 Laminin/Actin Laminin/Actin 0.2 0.25 0.00 0.0 0 5 10 15 30 60 0 5 10 15 30 60 Time in minutes Time in minutes Glucose+Insulin min Laminin β1 Actin 0 5 10 15 30 60 * * * 1.0 0.8 0.6 Laminin/Actin 0.4 0.2 0.0 0 5 10 15 30 60 Time in minutes S 2A. HG, HI and HG+HI induced laminin 1 synthesis in glomerular epithelial cells. Glomerular epithelial cells were treated with HG, HI and HG+HI for the time duration as shown in figure. Immunoblotting with laminin 1 antibody was performed on cell lysates. The lower panels in each figure show blots reprobed with anti-actin antibody to assess loading. Representative blots from 3 experiments are shown. †p<0.01,*p<0.05 vs control by ANOVA.
– – Insulin + + – + Glucose – Actinomycin(10μm) – – – + + Actinomycin(10μm) Cycloheximide(10μm) – – + – – + Cycloheximide(10μm) Laminin β1 Laminin β1 Actin Actin ‡ † * * 0.8 0.50 0.40 0.6 – – + + – + 0.30 Laminin/Actin Laminin/Actin 0.4 – – – – + + 0.20 – – + – – + 0.2 0.10 0.00 0.0 Glucose+Insulin – – + + – + Actinomycin(10μm) – – – – + + Cycloheximide(10μm) – – + – – + Laminin β1 Actin † * 0.8 0.6 Laminin/Actin 0.4 0.2 0.0 S 2B. Laminin β1 synthesis, induced by the three conditions in glomerular epithelial cells, was inhibited by cycloheximide but not by actinomycin D. MCT cells were pre-incubated with either actinomycin D or cycloheximide prior to incubation with or without HG, HI or HG+HI. Actinomycin D did not inhibit laminin 1 synthesis but cycloheximide did in cells treated with HG, HI and HG+HI. Loading was assessed by immunoblotting with actin antibody. ‡ p<0.001,† p<0.01,* p<0.05 by ANOVA.
Insulin Glucose Cycloheximide(10μm) Cycloheximide(10μm) – – + + P. p38 MAPK – + + P. p38 MAPK – p38 MAPK p38 MAPK Glucose+Insulin Cycloheximide(10μm) P. p38 MAPK – – – – + + + + – + + – + + – – p38 MAPK S 3. Cycloheximide induced p38 MAPKinase phosphorylation but not HG, HI or HG+HI. Cells were pre-incubated with cycloheximide, followed by treatment with or without HG, HI or HG+HI. Cycloheximide induced p38 MAPkinase phosphorylation but not HG, HI, or both together. Representative blots from 3 independent experiments are presented.
Glucose+Insulin Glucose – – + + Glucose LY 294002(25µM) – – + + Rapamycin(22nM) – – + + Laminin Laminin – – + + Actin Actin Insulin – – + + Insulin LY 294002(25µM) – + – + Rapamycin(22nM) Laminin Laminin Actin Actin – – + + – – + + Glucose+Insulin LY 294002(25µM) Rapamycin(22nM) – – + + – Laminin + – Laminin + Actin Actin – + + – – – + + S 4. A B LY294002 and rapamycin block HG-, HI- and HG+HI-induced laminin 1 synthesis. Quiescent MCT cells were incubated with or without 25 M LY294002, an inhibitor of PI3-kinase (A), or 22nM rapamycin, an inhibitor of mTOR (B), for 1 hour prior to treating the cells with HG, HI or HG+HI for 5 min. Immunoblotting with laminin 1 antibody was performed on cell lysates. The blots were reprobed with an anti-actin antibody assess loading. Representative blots from 3 independent experiments are shown.
Glucose Glucose Vector Vector DN-PI3-K DN-mTOR – – + + – – + + P. Akt P.p70S6K – – – + + – + + – + – + – + + – Insulin Insulin Vector Vector DN-PI-3K DN-mTOR P. Akt P.p70S6K – – – + – + + Glucose+Insulin + Glucose+Insulin Vector – – + + – – Vector + + DN-mTOR – + + – – + DN-PI-3K – + P. Akt P.p70S6K – – + + – – + + – – + + – – + + – – + + – + + – S 5. B A Expression of dominant negative PI3-kinase and kinase-dead mTOR constructs block phosphorylation of their downstream targets. These constructs do not carry a tag. Success of mutant transfection was demonstrated functionally by showing that HG-, HI- and HG+HI-induced increment in phosphorylation of Akt and p70S6Kinase, downstream substrates for PI3-kinase and mTOR, respectively, was blocked.