Download
1 / 13
130 likes | 136 Views
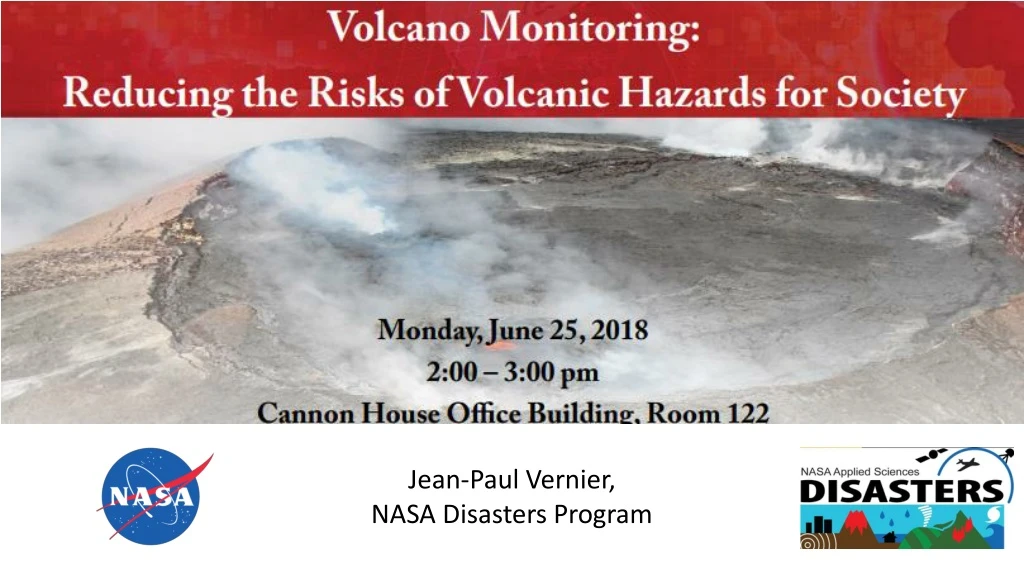
Jean-Paul Vernier, NASA Disasters Program. Contributing to the Group on Earth Observations and Sendai Framework For Disaster Risk Reduction. Satellites. Monitoring hazards, exposure and vulnerability.

E N D
Jean-Paul Vernier, NASA Disasters Program
Contributing to the Group on Earth Observations and Sendai Framework For Disaster Risk Reduction Satellites Monitoring hazards, exposure and vulnerability
Detecting Dramatic and Sudden Changes: Ground movement from Kilauea eruption as seen from Space ALOS-2 Ground Evolution between May8 and 22nd • Fissure formation, lava intrusions and other critical information needed by decision makers and communities.
Tracking Evolution and Threat as Kilauea Lava Races to the Ocean May 22nd and 24th Flowing lava and SO2 emissions, threaten safety and health of populations, damage to infrastructure with disruption to lifelines including power outages USGS, ESA, NASA Combining Information is key!
Measuring Rapid Surface Change and Impacts by Airborne Radar NASA-GLISTIN Measuring volume of material during the eruption enables estimates of how large the magma chamber is and how long the eruption may last 3-D Lava Flow on May 22
Locating Fires and Thermal Anomalies from Growing Lava Fountains June 11 LANCE Fire Information for Resource Management System (FIRMS) with VIIRS Nighttime imagery via Worldview May 4 to June 4 Lava fountains feed lava flow and threaten nearby communities, damage and loss to infrastructure Dr. Jean-Paul Vernier, June 11, 2018
Assessing Risk and Socioeconomic Impact to Inform Actions 3 Observations help inform population within Mandatory Evacuation Zone 4
Distinguishing Severe Flight and Air Quality RiskVolcanic Fog (VOG) Ash is a hazard to aviation; Sulfur Dioxide gas becomes sulfate particles (VOG) that pose air quality risks. VIIRS, June 7th 2018 Hawaii’s Big Island Volcanic Fog NASA MISR instrument distinguishes aerosol-type: - volcanic ash vs sulfate/water particles. 100 miles
Daily Monitoring of Increasing Sulfur Dioxide (SO2) Load and Mounting Hazard NASA SNPP/OMPS instrument provides daily SO2 measurements for air quality modeling The spread of SO2 affects air quality, climate, and causes acid rain over wide areas https://SO2.gsfc.nasa.gov
Analyzing Plume Height and Composition Risk NASA MISR Instrument – 9 cameras provide stereoscopic coverage of plume . V. Flower, R. Kahn /NASA GSFC Plume-height maps initialize models that predict the downwind evolution of potential air quality and aviation risks
NASA – Ongoing Monitoring of the Global Cities on Volcanoes Dramatic Eruption of Fuego, Guatemala Perils to life and lifelines are monitored to aiding search & rescue and to inform recovery with Damage Proxy Maps (DPMs) and Loss Models based on radar satellite imagery
Conclusion • NASA’s scientists and investigators use satellites and airborne systems to • Advance science, assessment and monitoring of volcano risk globally • Inform planning and response decisions • Enable risk reduction policies • NASA partners with domestic agencies and international observatories on an ongoing basis to • Promote open and timely data access • Coordinate disaster risk planning, response and recovery • Build capacity and sustainable resilience • Support emergency managers and communities at risk • For further information visit https://disasters.nasa.gov/.
Integrating VOG Plume-height and Emission Rates for Risk Mapping Plume heights + OMI UV and ASTER Infrared instruments estimate toxic sulfur dioxide (SO2) concentrations, a possible air quality risk.