Download
1 / 29
290 likes | 293 Views
Learn what earthquakes are, where they occur, their speed and strength, and how to locate their epicenters. Discover the potential effects of earthquakes on your neighborhood and learn about the causes and sizes of earthquakes.

E N D
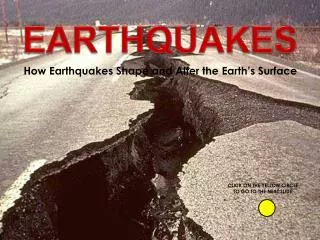
Earthquakes What they are Where they occur How fast they travel How to locate their centers Their strength
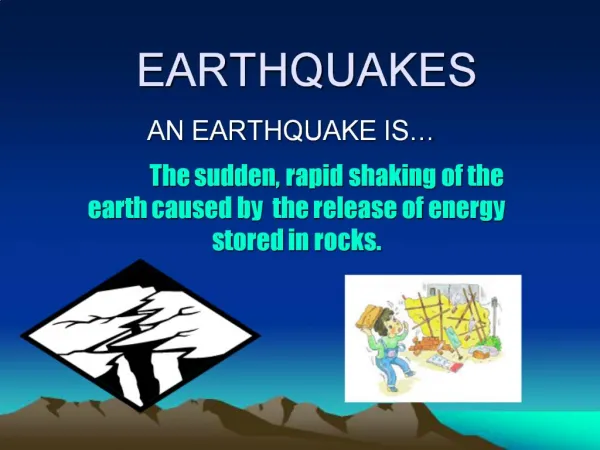
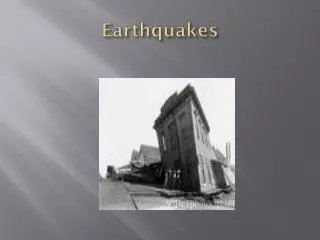
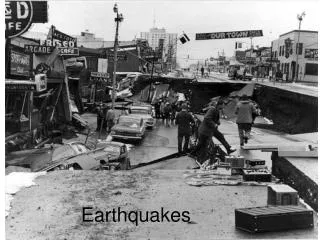
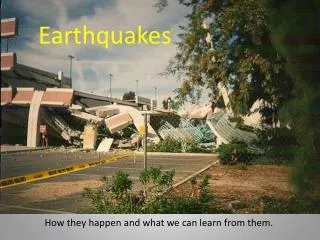
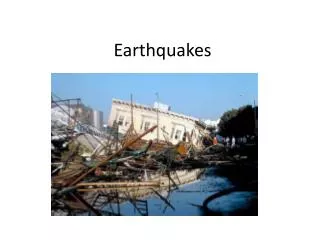
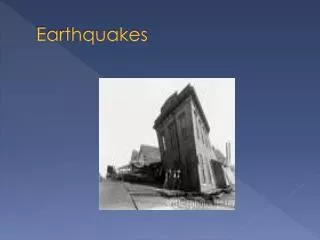
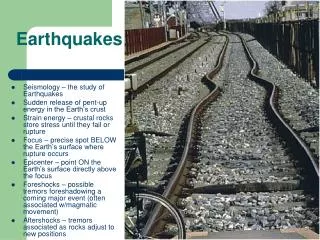
The Dynamic Crust – Earthquakes • Definition- a shaking of the Earth’s crust caused by a release of energy • Question: What might happen to Hauppauge if a major EQ hit? • Effects of an earthquake on your neighborhood: • buildings could collapse • fires and explosions from broken electric and gas lines • contaminated water supplies from sewer lines • emergency services overwhelmed or damaged • roads and rails for outside help and supply damaged
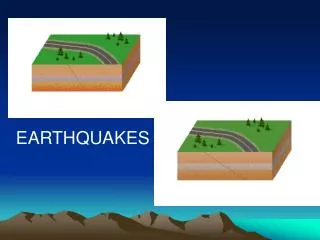
Causes of Earthquakes • Can be small in strength • An explosion • Some manmade action – train tracks! • Or large in strength • Volcano eruption • Movement of plates • Elastic Rebound Theory • plates move along the plate boundary (a faultline) • frictionmay stop or deform the plate’s shape • pressure builds up as plates try to move • plate finally snaps back to normal shape and moves to new location
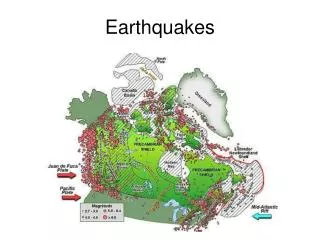
Depth and Location of Earthquakes • Depth of Earthquakes • dependent on type of plate boundary • most boundaries produce shallow quakes - 30 km deep • Many subduction zone quakes are deep – up to 700 km deep • This point below the surface where the plate actually slips or snaps is called the FOCUS • Epicenter – the point at the surface directly above the focus
Detecting Earthquakes • Seismometer • a device used to detect earthquake waves • horizontal form and vertical form • seismograph – the recording of the earthquake’s motions • P-waves or primary waves • compressional waves – like a slinky’smotion • pass through every phase of matter (solid/liquid/gas) • FAST waves • S-waves or secondary waves • shear waves – move side to side like a snake • only pass through solids like the inner core • SLOW waves
Size of Earthquakes • Charles Richter (1940’s) • developed the Richter scale • measures the total amount of energy released • each magnitude from 1-7 is 32 times stronger than previous magnitude • A magnitude 6 earthquake is: • 32x more powerful than a magnitude 5 • 1000x more powerful than a magnitude 4 • strongest recorded EQ • Chile, 1960 – 8.3 on Richter scale
Determining Distance to an Epicenter • EARTHQUAKE RELATIONSHIP # 1 • P and S waves travel at specific speeds • P – waves = faster • S – waves = slower • EARTHQUAKE RELATIONSHIP # 2 • the closer to the epicenter a seismograph is • the shorter the time lag between P and S waves • Look at ESRT on page 11
9:00:00 9:01:00 9:02:00 9:03:00 • The distance can be determined for any given EQ • Example #1 • An earthquake’s P wave reaches Hauppauge at 8:00:00 am. Its S wave hits Hauppauge at 8:05:40 am. How far away was the earthquake in km? Note 103 km = 1000 km • Example #2 • Use the seismograph below. How far away is the earthquake represented by the P and S waves?
An earthquake occurs, and the P and S waves are recorded at three seismometers across the US • Lets determine where the epicenter is located….
Use the data from the recording stations: • Station A: San Francisco, California P-Wave arrival 3:02:20 S-Wave arrival 3:06:30 What is the time difference between P and S wave arrivals? 4:10
Use the data from the recording stations: • Station B: Denver, Colorado P-Wave arrival 3:01:40 S-Wave arrival 3:05:00 What is the time difference between P and S wave arrivals? 3:20
Use the data from the recording stations: • Station C: Missoula, Montana P-Wave arrival 3:01:00 S-Wave arrival 3:03:00 What is the time difference between P and S wave arrivals? 2:00
TAKE A PIECE OF PAPER, AND MARK OFF THE DIFFERENCE IN ARRIVAL TIME 4:10 2800Km
MOVE THE PAPER UNTIL THE TWO TICK MARKS LINE UP WITH THE P AND S CURVES WHEN TICK MARKS LINE UP, GO STRAIGHT DOWN AND READ THE EPICENTER DISTANCE EPICENTER DISTANCE OF 2800 KM
EPICENTER DISTANCES San Francisco: 4:10 2,800km Denver, Colorado: 3:20 2,000km Missoula, Montana 2:00 1100km
Recording BoardDifference in arrival times: San Francisco: 41:0 2,800km Open your compass to the EXACT distance on the scale. 3,000 4,000 5,000 2,000 1,000
Use your carefully set compass to draw a circle around each city. . . . You've found the epicenter!
Determining Location • Triangulation – a process of finding location • Requires three seismic stations • distance from three different stations used to find the epicenter Earthquake Epicenter