Download
1 / 20
200 likes | 319 Views
Del Rio Elementary 2011-2012 Behavior Report Card (# of N’s ) 5 th Grade by Trimester. There was a 56% decrease in 1 st trimester N’s. Del Rio Elementary Behavior Report Card Data (# of N’s ) Comparing 1 st trimester 4 th (2011) to 5 th (2012). The number of N’s decreased by 31%.

E N D
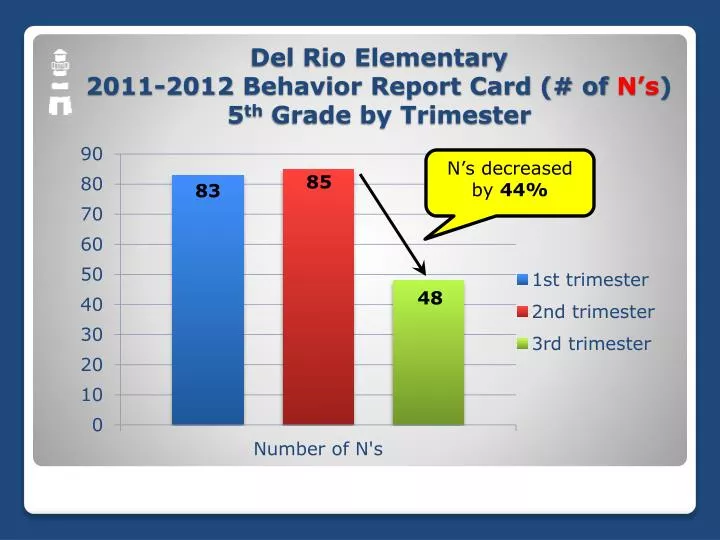
Del Rio Elementary2011-2012 Behavior Report Card (# of N’s)5th Grade by Trimester
There was a 56% decrease in 1st trimester N’s Del Rio Elementary Behavior Report Card Data (# of N’s)Comparing 1st trimester 4th (2011) to 5th (2012)
The number of N’s decreased by 31% Del Rio Elementary2012 Report Card Data (# of N’s)1st Trimester Annual Totals Grades 3-5
40% reduction (decrease of 567) unexcused absences) Total Number of Unexcused Absences(Palmquist)
The total number of referrals has decreased by 52% Palmquist: Total Number of Discipline Referrals
The total number of N’s has decreased by 37% PalmquistTotal Number of 3rd-5th Grade N’s
Palmquist 1st Trimester N’s(Following 5th Grade Class of 2013-2014)
The total number of N’s and U’s has decreased by 31% Palmquist: Total Number N’s and U’s (Grade 3-5)
A decrease of 84 unexcused absences from 2010-2011 to 2011-2012. Total Number of Unexcused AbsencesSan Luis Rey
In 2010/2011, both playground and office were documented in Aeries. In 2011/2012, only office referrals were collected. San Luis Rey Total Number of Discipline Referrals
A percentage decrease of 75%! San Luis Rey Total Number of Suspensions
The total number of N’s has decreased by 23% in 2010! San Luis Rey Total Number of 3rd-5th Grade N’s
The total number of N’s decreased by 60% in 2011! San Luis Rey Total Number of 3rd-5th Grade N’s
Libby ElementaryTotal Number of N’s and U’s for 3rd-5th Grade
15% Decrease! Grant Goal Met! Oceanside Unified School DistrictTotal (4 Schools) - Unexcused Absences
15% Decrease Grant Goal Met! Oceanside Unified School DistrictTotal Number (4 Schools) of Referrals
11% Decrease! Grant Goal Met! Oceanside Unified School District Total (4 Schools) - 1st Tri. N’s and U’s
15% Increase Grant Goal Met! Oceanside Unified School DistrictPercentage of Students (4 Schools) Rating “High” on CHKS School Environment
2% increase Grant Goal Not met (yet) Oceanside Unified School DistrictPercentage of Students (4 Schools) Scoring Proficient or Above on CST