Download
1 / 6

E N D
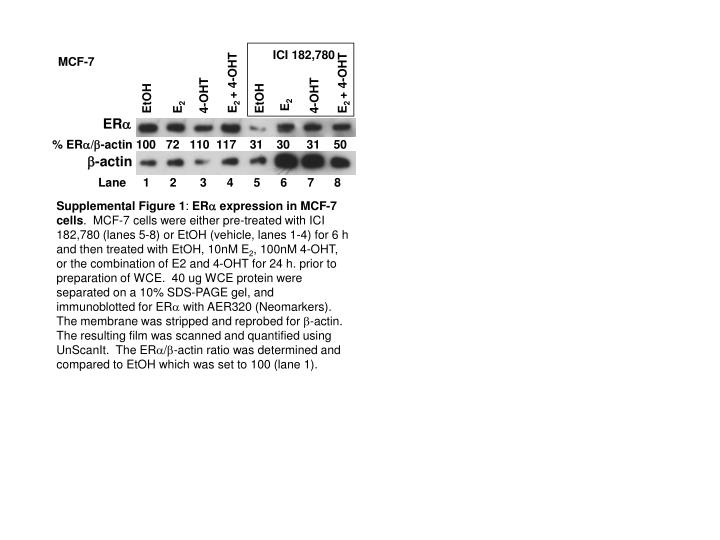
Lane 1 2 3 4 5 6 7 8 Supplemental Figure 1: ERa expression in MCF-7 cells.MCF-7 cells were either pre-treated with ICI 182,780 (lanes 5-8) or EtOH (vehicle, lanes 1-4) for 6 h and then treated with EtOH, 10nM E2, 100nM 4-OHT, or the combination of E2 and 4-OHT for 24 h. prior to preparation of WCE. 40 ug WCE protein were separated on a 10% SDS-PAGE gel, and immunoblotted for ERa with AER320 (Neomarkers). The membrane was stripped and reprobed for b-actin. The resulting film was scanned and quantified using UnScanIt. The ERa/b-actin ratio was determined and compared to EtOH which was set to 100 (lane 1).
1.5 T47D 1.0 Fold change 0.5 0.0 EtOH E2 Supplemental Figure 2: E2 does not regulate miR-21 in T47D cells.T47D breast cancer cells were treated with EtOH (vehicle) or 10 nM E2 for 6 h. Q-PCR data on (mature) miR-21 expression are fold increase compared to EtOH and were calculated as described in Materials and Methods. Values are the average of 3 separate experiments ± SEM.
7.0 MCF-7 Q-PCR ERa ERb 6.0 5.0 4.0 Fold change 3.0 2.0 1.0 0.0 EtOH E2 PPT DPN EtOH E2 PPT DPN siControl siERa Supplemental Figure 3: siRNA ERa knockdown in MCF-7 cells. MCF-7 cells weretransfected with siControl or siERa for 48 h as described in Materials and Methods. Cells were then treated with EtOH or 10 nM E2, PPT, or DPN for 6 h. RNA was harvested and Q-PCR performed using Taqman primer/probe sets from ABI as described in Materials and Methods. Shown are the mean ± SEM for triplicate determinations from a representative experiment.
siERa siControl EtOH EtOH DPN DPN PPT PPT Ab E2 E2 ERa A HC-20 ERa B AER320 1.2 C HC-20 AER320 siControl 1.0 0.8 Relative ERa 0.6 siERa 0.4 0.2 0.0 EtOH E2 PPT DPN EtOH E2 PPT DPN Supplemental Figure 4: siRNA ERa knockdown in MCF-7 cells. MCF-7 cells weretransfected with siControl or siERa for 48 h as described in Materials and Methods. Cells were then treated with EtOH or 10 nM E2, PPT, or DPN for 24 hr. 10 ug WCE protein was applied to each well of a slot-blot apparatus. Shown are western slot blots for ERa using ERa antibodies HC-20 from SantaCruz (A) or AER320 from Neomarkers (B). Quantitation of the signal of ERa is shown in C.
A B 1.2 ERa 1.0 ERb 0.8 0.6 Fold change 0.4 0.2 0.3 0.0 EtOH E2 EtOH E2 0.2 siControl siERb ERb/b-actin C 2.5 0.1 PDCD4 PTEN BCL2 2.0 0.0 0 10 20 30 10 20 30 nmoles siControl 1.5 siERb Fold change 1.0 0.5 0.0 EtOH E2 PPT DPN EtOH E2 PPT DPN siControl siERb Supplemental Figure 5: siRNA ERb knockdown in MCF-7 cells. MCF-7 cells weretransfected with siControl or siERb for 48 h and then treated with EtOH or 10 nM E2 for 6 h as described in Materials and Methods. A) Q-PCR for ERa and ERb mRNA expression reveals a 70% knockdown of ERb mRNA. B) WCE were prepared and 40 mg of protein were separated on a 10% SDS-PAGE gel. Western blot was performed with H150 ERb antibody. The membrane was stripped and reprobed for b-actin. The ERb/b-actin ratio is plotted. 30 nmoles siERb resulted in a ~64% knockdown of ERb protein. C) Q-PCR for PDCD4, PTEN, and BCL2 in MCF-7 cells transfected with siControl or siERb (48 h) and treated with 10 nM E2, PPT, or DPN for 6 h. Values are the average of 4 separate determinations ± SEM.
A B Supplemental Figure 6: E2-ERa binding in MCF-7 cells overlaps miR-21. The data used for the figure were derived from http://research4.dfci.harvard.edu/brownlab//datasets/ER_MCF7_whole_human_gen ome/Hg18/ERFDR20_hg18.bed from Myles Brown’s online database of genomic E2-ERa binding sites in MCF-7 cells using the UCSC Genome browser http://genome.ucsc.edu/cgi-bin/hgGateway for the human March 2006 assembly. Also shown is the location of TMEM49 and the high conservation of the miR-21 site. A) Chr 17: 55,269,845-55,277,044: both E2-ERa (black) binding overlaps with the 71 bp miR-21 gene (MIRN21, blue). B) Chr 17: 55,273,408-55,273,479: E2-ERa binding (black) overlaps with the 71 bp miR-21 gene (blue). Special thanks to Drs. Myles Brown and Mathieu Lupien from Harvard and Dr. Ted Kalbflesich (UofL) for their help with these data.