Download
1 / 65
650 likes | 795 Views
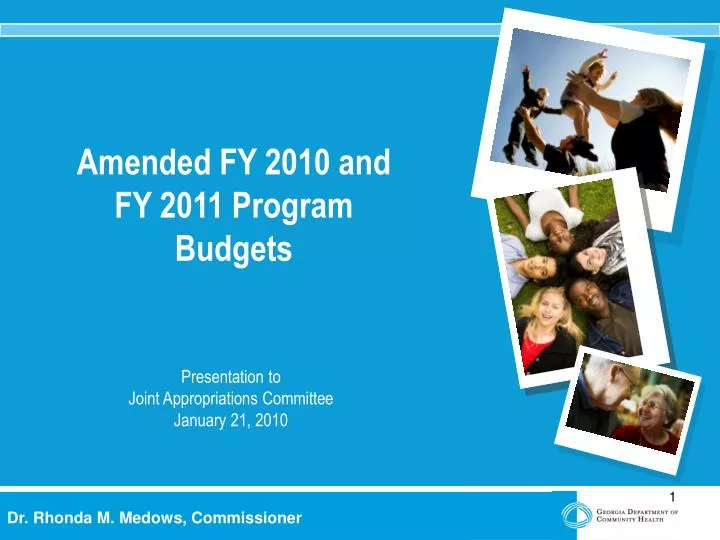
Amended FY 2010 and FY 2011 Program Budgets. Presentation to Joint Appropriations Committee January 21, 2010. Dr. Rhonda M. Medows, Commissioner. DCH Mission. RESPONSIBLE. HEALTHY. ACCESS. Access to affordable, quality health care in our communities.

E N D
Amended FY 2010 and FY 2011 Program Budgets Presentation to Joint Appropriations Committee January 21, 2010 Dr. Rhonda M. Medows, Commissioner
DCH Mission RESPONSIBLE HEALTHY ACCESS Access to affordable, quality health care in our communities Responsible health planning and use of health care resources Healthy behaviors and improved health outcomes 2
DCH: Budget Total DCH State Funds FY2010: $2.2Billion
DCH FY 2010 State Fund Budget *State funds for Medicaid & PCK Benefits include tobacco funds and provider fees
DCH Administration Budget DCH Admin Budget is 4% of the Department Budget
DCH Administration: Governor’s Budget Governor’s Budget AFY 2010: pg 79 FY 2011: pg 114
Healthcare Access Budget: Governor’s Budget AFY 2010: pg 80 FY 2011: pg 115
DCH – Healthcare AccessAFY 2010 Governor’s Recommendation
Healthcare Facility Regulation Budget Healthcare Facility Regulation = Planning & Regulatory Services
Healthcare Facility Regulation: Governor’s Budget Governor’s Budget AFY 2010: pg 84 FY 2011: pg 119
DCH – Healthcare Facility RegulationAFY 2010 Governor’s Recommendation
DCH – Healthcare Facility RegulationFY 2011 Governor’s Recommendation
Division of Public HealthAFY 2010 Governor’s Recommendation
Division of Public HealthAFY 2010 Governor’s Recommendation
Public Health State Level Fee Effective April 1, 2010 *Assume 35% of lab test recipients do not have an ability to pay and that service will be provided. **Does not include offset for administrative costs for the lab to collect the fees
Public Health State Level Fee FY 2011 *Assume 35% of lab test recipients do not have an ability to pay and that service will be provided. **Does not include offset for administrative costs for the lab to collect the fees
Division of Public Health – Grant In AidAFY 2010 Governor’s Recommendation
Division of Public Health – Grant In AidFY 2011 Governor’s Recommendation
Division of Emergency Preparedness & ResponseAFY 2010 Governor’s Recommendation
Division of Emergency Preparedness & ResponseFY 2011 Governor’s Recommendation
State Health Plan Average Monthly Enrollment .5% Increase PMPM 13.5% Increase
FY 2009 Revenue/Expense Statement Employers contributed 72% towards SHBP expense Employees contributed 28% towards SHBP expense
SHBP Highlights of FY2009 • Year 2 of a 5 year strategy to streamline administration and focus on consumerism • CDHP plan enrollment increased from 4% to 18% • Higher risk population and increased utilization of services resulted in highest trend of all products • Despite higher CDHP trends, CDHP plans continue to be more cost effective than the HMO/PPO plans • HRA plan experienced higher adherence for preventive care screenings in all categories than HMO/PPO plans • Increased utilization of services across all options and significant increase in catastrophic (>$100k) claims • In FY2009 SHBP returned funds to the treasury and used the current fund balance to pay claims • Employer contributions from FY08 to FY09 reduced by $483.5 m • DOE contributions reduced by $124.5m (using $30.3m from prior year contributions) CDHP = Consumer Driven Health Plan HRA = Health Reimbursement Arrangement
SHBP Highlights FY2010 *Projected savings for FY2010 and FY2011 combined Governor’s Budget AFY 2010: pg 84
SHBP Highlights FY2010 *Projected savings for FY2010 and FY2011 combined Governor’s Budget AFY 2010: pg 84
FY 2010 Governor’s Recommendation Governor’s Budget AFY 2010: pg 84
FY 2010 Governor’s Recommendation Governor’s Budget AFY 2010: pg 84
FY 2011 Governor’s Recommendation Governor’s Budget FY 2011: pg 119
FY 2011 Governor’s Recommendation Governor’s Budget FY 2011: pg 119
Medicaid Medicaid State Funds = 9.8% of Georgia’s FY10 State General Fund
Medicaid: Annual Expenditure Growth Rate Annual Increases Incurred Medicaid Benefit Expenditures Medicaid Annual Expenditure Growth FY2009: 5% Georgia has trended below national Medicaid experience for the past 5 years.
FY 2010-2011 Projected Medicaid LIM Enrollment LIM Enrollment 7.7% Increase June 09 to June 10 Projected: 2% June 10 to June11 FY 2010 and 2011 Projection (based on June 2009 Enrollment Data) FY 2009 Actual June 2009 = 997,488 June 2010 = 1,074,482 June 2011 = 1,096,502
FY 2010-2011 Projected ABD Enrollment ABD Enrollment 1.6% June 09 to June 10 1.4% June 10 to June 11 Projected FY 2009 Actual FY 2010 and FY 2011 Projection based on June Enrollment 2009 Data June 2009 = 391,481 June 2010 = 397,681 June 2011 = 403,264
FY 2010-2011 Projected PCK Enrollment PeachCare Enrollment 8.0% June 09 to June 10 8.0% June 10 to June 11 Projected FY 2010 and 2011 Projection June 2009 Enrollment Data) FY 2009 Actual June 2009 = 205,370 June 2010 = 221,972 June 2011 = 239,917