Download
1 / 14
140 likes | 264 Views
Using DataFed to Build Fire-related Web Applications. Stefan R. Falke, Rudolf B. Husar, Kari Höijärvi , and Mrunal Parikh Center of Air Pollution Impact and Trend Analysis Washington University St. Louis, Missouri. Earth-Sun System Technology Conference June 2005.

E N D
Using DataFed to Build Fire-related Web Applications Stefan R. Falke, Rudolf B. Husar, Kari Höijärvi, and Mrunal Parikh Center of Air Pollution Impact and Trend Analysis Washington University St. Louis, Missouri Earth-Sun System Technology Conference June 2005
Distributed Fire Data Sources Canadian Wildland Fire Information System Web Fire Mapper - UMaryland NOAA-HMS BlueSkyRAINS FS Active Fire Maps GeoMAC WFAS The challenge is to bring data together, on-the-fly, without requiring substantial changes to the underlying data systems. For example, air quality modelers and managers struggle with the uncertainty associated with the multiple fire location datasets that exist.
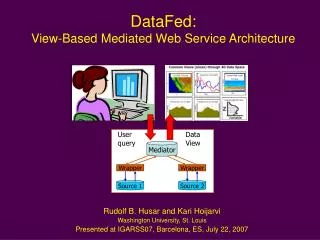
The air quality community is supported by a non-intrusive, incremental data integration infrastructure based on Internet standards (web services) and a set of web-tools evolving through the federated data system, DataFed. (Husar et al, 2004) Federated Data System - DataFed http://datafed.net
DataFed Viewer Forest Service Wildland Fire Assessment System (WFAS) Provides fire weather data (meteorology and fire indices such as drought, burning index, and energy release) at monitoring stations. URL-addressable text files are “wrapped” for dynamic and up-to-date DataFed browsing in maps and time series. June 25, 2005 Time series for station at southern Nevada/Utah border
BLM HMS Maps Integrated Data Service Flow Name = web service Settings Wrappers MapPointAccess MapPointRender DataSet = VIEWS Date=7/7/2002 Parameter=MF Color = Yellow Symbol=Circle Width=Proport. Data Cubes MapPointAccess MapPointRender MODIS DataSet = FS_MODIS Date=7/7/2002 Parameter=FireLoc Color = Red Symbol=Circle Width=2 MapImageOverlay Layer Order = FS_MODIS,VIEWS, N.Am, SeaWiFS MapImageRender MapImageAccess lat_min = 35 lat_max = 55 lon_min = -80 lon_max = -65 DataSet = SeaWiFS Date=7/7/2002 Parameter=Reflect. SeaWiFS MapImageAccess MapImageRender Color= Black Size=2 DataSet = N.Am. Borders The settings of each web service can be changed by the user, creating a dynamic application
Images + Controllers in a Web Page = Web Application DataSet Controller Date Controller The controllers and map image view can be linked and assembled in a web page. Changing the settings of a controller changes the URL of the map image and updates the web page. The web page can be constructed using standard web application programming languages, such as JavaScript and ASP. http://www.datafed.net/WebApps/MiscApps/Fire/FireLocation.htm
Spatial-temporal analysis of fire counts Large fires during the summer of 2004 in Central Alaska. Spatially aggregated count of fire pixels over a 100km2 area. The size of each red square in the map is proportional to the number of fire pixels. The spatial aggregation allows the generation of a time series for each aggregated area. http://webapps.datafed.net/dvoy_services/datafed.aspx?page=Fire_Pixel_Count_AK
Spatial-temporal comparison of satellite derived fire pixels Aggregating fire location data to a common spatial and temporal frame of reference offers a way to compare multiple datasets. On July 14, 2004 both MODIS and GOES fire pixel datasets from the NOAA-NESDIS HMS detect fires in Kansas. In general, GOES contains a larger number of fire pixels due, in part, to its higher sampling frequency (15 minutes versus approximately once per day for MODIS). The corresponding June-October 2004 time series for the highlighted location superimposes the temporal trend of the MODIS (red) and GOES (blue) fire pixel count.
BLM Area burned - monthly average The acres burned in the BLM compiled fire history dataset are spatially aggregated on a 50km2 grid and temporally aggregated to a monthly resolution. Circles are proportional to the acres burned at a location for a particular year and month. Time series plot shows the monthly total number of acres burned at a particular 50km2 area. http://webapps.datafed.net/dvoy_services/datafed.aspx?page=BLM_AcresBurned
Spatial-temporal Comparison of fire pixels A red shaded square indicates a short distance separating the MODIS and GOES pixels while a blue shaded square indicates the nearest neighbor between the datasets were far apart. A red outlinedsquare indicates the nearest neighbor was detected on the same day while a blue outlined square indicates a longer time separation. Gray shaded and/or outlined squares indicate that a nearest neighbor was not found between the two datasets given the search parameters (in this example case, 100 km and 2 days). http://www.datafed.net/WebApps/MiscApps/ModisGoes/FireLocationComparison.htm
Comparison of satellite and surface fire location data http://www.datafed.net/WebApps/MiscApps/Fire/FireLocationComparison_timespanV2.htm A red square indicates a short distance separating the MODIS fire pixels and FS Fire Incidents while a blue square indicates the nearest neighbor between the datasets were far apart. Gray squares indicate that a nearest neighbor was not found between the two datasets.
Quebec Fires July 2002 Smoke from fires in Quebec cause high (>65 ug/m3) concentrations of fine particulate matter in the northeastern US MODIS fire pixels from Forest Service Remote Sensing Applications Center SeaWiFS surface reflectance from CAPITA Air quality (fine mass) concentration data from VIEWS (Colorado State Univ.) database http://webapps.datafed.net/dvoy_services/datafed.aspx?page=Fire/QuebecFiresJuly2002.page
Standards Based Data Sharing Open Geospatial Specifications (OGC) for web mapping Web Map Service (images) Web Feature Service (point/vector data) Web Coverage Service (gridded data) Geospatial One-Stop – The National Map DataFed OGC WMS for fire data: http://webapps.datafed.net/dvoy_services/ogc_domain_fire.wsfl?SERVICE=WMS&VERSION=1.1.1&REQUEST=GetCapabilities DataFed-OGC Description:http://www.datafed.net/DataLinks/OGC/OGC.htm