Download
1 / 93
930 likes | 934 Views
This survey examines various risk behaviors among high school students in New Jersey, including bike helmet use, seat belt use, alcohol consumption, weapon carrying, and more.

E N D
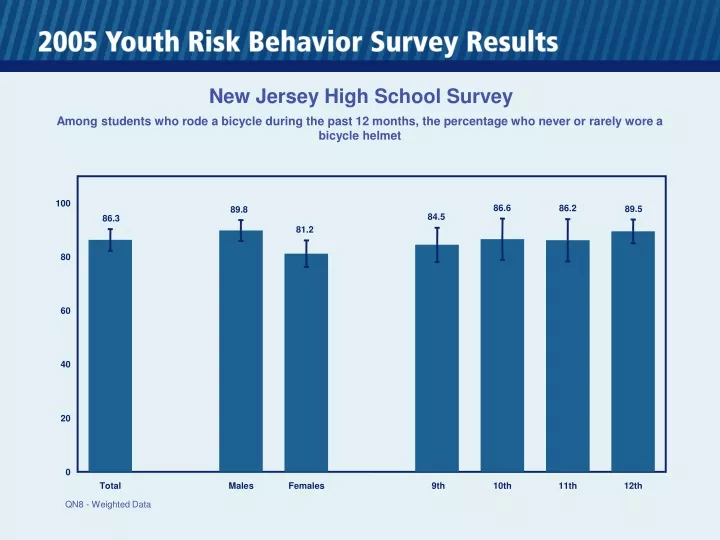
New Jersey High School Survey Among students who rode a bicycle during the past 12 months, the percentage who never or rarely wore a bicycle helmet 100 86.6 86.2 89.5 89.8 84.5 86.3 81.2 80 60 40 20 0 Total Males Females 9th 10th 11th 12th QN8 - Weighted Data
New Jersey High School Survey Percentage of students who never or rarely wore a seat belt when riding in a car driven by someone else 100 80 60 40 20 10.7 8.5 8.7 8.3 8.1 8.4 6.1 0 Total Males Females 9th 10th 11th 12th QN9 - Weighted Data
New Jersey High School Survey Percentage of students who rode in a car or other vehicle driven by someone who had been drinking alcohol one or more times during the past 30 days 100 80 60 35.3 40 29.6 27.5 27.7 27.2 27.5 18.9 20 0 Total Males Females 9th 10th 11th 12th QN10 - Weighted Data
New Jersey High School Survey Percentage of students who drove a car or other vehicle when they had been drinking alcohol one or more times during the past 30 days 100 80 60 40 16.6 12.5 20 11.6 9.6 7.5 6.3 4.4 0 Total Males Females 9th 10th 11th 12th QN11 - Weighted Data
New Jersey High School Survey Percentage of students who carried a weapon such as a gun, knife, or club on one or more of the past 30 days 100 80 60 40 17.3 20 10.8 11.4 10.0 10.0 10.5 3.7 0 Total Males Females 9th 10th 11th 12th QN12 - Weighted Data
New Jersey High School Survey Percentage of students who carried a gun on one or more of the past 30 days 100 80 60 40 20 4.3 3.1 2.7 2.3 2.3 1.1 0.3 0 Total Males Females 9th 10th 11th 12th QN13 - Weighted Data
New Jersey High School Survey Percentage of students who carried a weapon such as a gun, knife, or club on school property on one or more of the past 30 days 100 80 60 40 20 5.3 4.5 2.8 2.6 2.6 3.1 0.9 0 Total Males Females 9th 10th 11th 12th QN14 - Weighted Data
New Jersey High School Survey Percentage of students who did not go to school because they felt unsafe at school or on their way to or from school on one or more of the past 30 days 100 80 60 40 20 5.1 4.5 4.1 4.7 4.4 4.4 3.5 0 Total Males Females 9th 10th 11th 12th QN15 - Weighted Data
New Jersey High School Survey Percentage of students who had been threatened or injured with a weapon such as a gun, knife, or club on school property one or more times during the past 12 months 100 80 60 40 20 10.5 10.5 8.8 8.0 7.1 4.9 5.4 0 Total Males Females 9th 10th 11th 12th QN16 - Weighted Data
New Jersey High School Survey Percentage of students who had property, such as their car, clothing, or books stolen or deliberately damaged on school property one or more times during the past 12 months 100 80 60 33.1 33.1 32.9 40 29.4 30.1 31.5 29.7 20 0 Total Males Females 9th 10th 11th 12th QN17 - Weighted Data
New Jersey High School Survey Percentage of students who were in a physical fight one or more times during the past 12 months 100 80 60 38.0 36.5 40 29.9 30.7 26.7 26.0 24.8 20 0 Total Males Females 9th 10th 11th 12th QN18 - Weighted Data
New Jersey High School Survey Percentage of students who were injured in a physical fight and had to be treated by a doctor or nurse one or more times during the past 12 months 100 80 60 40 20 6.3 5.6 3.9 2.8 4.0 2.7 2.4 0 Total Males Females 9th 10th 11th 12th QN19 - Weighted Data
New Jersey High School Survey Percentage of students who were in a physical fight on school property one or more times during the past 12 months 100 80 60 40 14.0 14.0 20 11.1 10.1 8.7 6.1 5.3 0 Total Males Females 9th 10th 11th 12th QN20 - Weighted Data
New Jersey High School Survey Percentage of students who ever tried cigarette smoking, even one or two puffs 100 80 59.5 56.9 60 49.8 48.3 49.0 44.6 37.9 40 20 0 Total Males Females 9th 10th 11th 12th QN28 - Weighted Data
New Jersey High School Survey Percentage of students who smoked a whole cigarette for the first time before age 13 years 100 80 60 40 20 9.7 10.1 7.8 8.6 8.1 8.6 7.2 0 Total Males Females 9th 10th 11th 12th QN29 - Weighted Data
New Jersey High School Survey Percentage of students who smoked cigarettes on one or more of the past 30 days 100 80 60 40 26.9 22.9 20.6 19.8 19.0 16.4 14.5 20 0 Total Males Females 9th 10th 11th 12th QN30 - Weighted Data
New Jersey High School Survey Percentage of students who smoked cigarettes on 20 or more of the past 30 days 100 80 60 40 20 11.3 9.7 7.4 6.6 7.0 4.0 3.7 0 Total Males Females 9th 10th 11th 12th QNFRCIG - Weighted Data
New Jersey High School Survey Among students who are current smokers, the percentage who smoked more than 10 cigarettes per day on the days they smoked during the past 30 days 100 80 60 40 20 9.1 6.3 3.8 0 Total Males Females 9th 10th 11th 12th QN31 - Weighted Data Missing bars indicate less than 100 respondents in the subgroup.
New Jersey High School Survey Percentage of students who had at least one drink of alcohol on one or more days during their life 100 88.2 85.1 81.1 79.1 77.1 71.7 72.5 80 60 40 20 0 Total Males Females 9th 10th 11th 12th QN39 - Weighted Data
New Jersey High School Survey Percentage of students who had their first drink of alcohol other than a few sips before age 13 years 100 80 60 40 23.0 21.6 19.7 19.6 20.1 18.2 18.6 20 0 Total Males Females 9th 10th 11th 12th QN40 - Weighted Data
New Jersey High School Survey Percentage of students who had at least one drink of alcohol on one or more of the past 30 days 100 80 62.4 54.4 60 49.0 46.5 43.9 36.4 35.5 40 20 0 Total Males Females 9th 10th 11th 12th QN41 - Weighted Data
New Jersey High School Survey Percentage of students who had five or more drinks of alcohol in a row, that is, within a couple of hours, on one or more of the past 30 days 100 80 60 42.0 34.0 40 27.8 26.6 27.2 18.0 17.6 20 0 Total Males Females 9th 10th 11th 12th QN42 - Weighted Data
New Jersey High School Survey Percentage of students who had at least one drink of alcohol on school property on one or more of the past 30 days 100 80 60 40 20 5.0 4.4 4.0 3.2 2.8 3.7 3.1 0 Total Males Females 9th 10th 11th 12th QN43 - Weighted Data
New Jersey High School Survey Percentage of students who used marijuana one or more times during their life 100 80 49.3 60 46.1 38.1 35.8 33.5 29.8 40 21.6 20 0 Total Males Females 9th 10th 11th 12th QN44 - Weighted Data
New Jersey High School Survey Percentage of students who tried marijuana for the first time before age 13 years 100 80 60 40 20 7.6 7.1 4.3 4.6 3.4 2.6 2.1 0 Total Males Females 9th 10th 11th 12th QN45 - Weighted Data
New Jersey High School Survey Percentage of students who used marijuana one or more times during the past 30 days 100 80 60 40 28.0 25.7 22.0 19.9 17.8 15.1 12.6 20 0 Total Males Females 9th 10th 11th 12th QN46 - Weighted Data
New Jersey High School Survey Percentage of students who used marijuana on school property one or more times during the past 30 days 100 80 60 40 20 5.1 4.3 3.7 3.4 2.5 3.4 1.8 0 Total Males Females 9th 10th 11th 12th QN47 - Weighted Data
New Jersey High School Survey Percentage of students who used any form of cocaine, including powder, crack, or freebase one or more times during their life 100 80 60 40 20 8.4 6.4 6.5 5.7 5.0 4.6 3.9 0 Total Males Females 9th 10th 11th 12th QN48 - Weighted Data
New Jersey High School Survey Percentage of students who used any form of cocaine, including powder, crack, or freebase one or more times during the past 30 days 100 80 60 40 20 3.2 2.1 2.1 1.9 2.0 2.0 0.9 0 Total Males Females 9th 10th 11th 12th QN49 - Weighted Data
New Jersey High School Survey Percentage of students who sniffed glue, breathed the contents of aerosol spray cans, or inhaled any paints or sprays to get high one or more times during their life 100 80 60 40 12.4 20 11.5 10.4 10.7 10.1 8.7 6.3 0 Total Males Females 9th 10th 11th 12th QN50 - Weighted Data
New Jersey High School Survey Percentage of students who used heroin one or more times during their life 100 80 60 40 20 1.8 1.7 1.4 1.7 1.4 0.7 0.9 0 Total Males Females 9th 10th 11th 12th QN51 - Weighted Data
New Jersey High School Survey Percentage of students who used methamphetamines one or more times during their life 100 80 60 40 20 3.3 2.9 3.4 2.4 2.6 2.0 2.0 0 Total Males Females 9th 10th 11th 12th QN52 - Weighted Data
New Jersey High School Survey Percentage of students who used ecstasy one or more times during their life 100 80 60 40 20 6.7 5.7 5.2 4.8 5.0 4.2 3.8 0 Total Males Females 9th 10th 11th 12th QN53 - Weighted Data
New Jersey High School Survey Percentage of students who took steroid pills or shots without a doctor's prescription one or more times during their life 100 80 60 40 20 2.8 3.5 2.4 2.4 2.1 2.4 1.4 0 Total Males Females 9th 10th 11th 12th QN54 - Weighted Data
New Jersey High School Survey Percentage of students who used a needle to inject any illegal drug into their body one or more times during their life 100 80 60 40 20 1.7 1.6 1.1 0.9 0.6 0.1 0.1 0 Total Males Females 9th 10th 11th 12th QN55 - Weighted Data
New Jersey High School Survey Percentage of students who were offered, sold, or given an illegal drug on school property by someone during the past 12 months 100 80 60 39.3 38.2 36.3 29.8 40 32.6 26.2 27.0 20 0 Total Males Females 9th 10th 11th 12th QN56 - Weighted Data
New Jersey High School Survey Percentage of students who ever had sexual intercourse 100 67.9 80 50.6 60 44.4 44.2 44.0 37.4 40 25.5 20 0 Total Males Females 9th 10th 11th 12th QN57 - Weighted Data
New Jersey High School Survey Percentage of students who had sexual intercourse for the first time before age 13 years 100 80 60 40 20 7.0 5.7 6.1 4.8 3.8 3.4 2.7 0 Total Males Females 9th 10th 11th 12th QN58 - Weighted Data
New Jersey High School Survey Percentage of students who had sexual intercourse with four or more people during their life 100 80 60 40 19.2 13.6 13.9 20 11.6 7.8 9.8 7.1 0 Total Males Females 9th 10th 11th 12th QN59 - Weighted Data
New Jersey High School Survey Percentage of students who had sexual intercourse with one or more people during the past three months 100 80 49.0 60 40.8 34.6 32.8 30.8 40 25.2 19.6 20 0 Total Males Females 9th 10th 11th 12th QN60 - Weighted Data
New Jersey High School Survey Among students who had sexual intercourse during the past three months, the percentage who drank alcohol or used drugs before last sexual intercourse 100 80 60 40 25.0 24.5 22.5 21.8 19.0 20 0 Total Males Females 9th 10th 11th 12th QN61 - Weighted Data Missing bars indicate less than 100 respondents in the subgroup.
New Jersey High School Survey Among students who had sexual intercourse during the past three months, the percentage who used a condom during last sexual intercourse 100 74.6 78.8 71.2 80 68.4 64.7 60 40 20 0 Total Males Females 9th 10th 11th 12th QN62 - Weighted Data Missing bars indicate less than 100 respondents in the subgroup.
New Jersey High School Survey Among students who had sexual intercourse during the past three months, the percentage who used birth control pills to prevent pregnancy before last sexual intercourse 100 80 60 23.8 40 18.0 15.0 15.5 12.5 20 0 Total Males Females 9th 10th 11th 12th QN63 - Weighted Data Missing bars indicate less than 100 respondents in the subgroup.
New Jersey High School Survey Percentage of students who were at risk for becoming overweight (i.e., at or above the 85th percentile but below the 95th percentile for body mass index, by age and sex)* 100 80 60 40 17.1 17.7 16.7 14.3 15.4 13.5 13.1 20 0 Total Males Females 9th 10th 11th 12th *QNROVWGT - Weighted Data - Based on reference data from the National Health and Nutrition Examination Survey I.
New Jersey High School Survey Percentage of students who were overweight (i.e., at or above the 95th percentile for body mass index, by age and sex)* 100 80 60 40 14.6 12.5 12.4 20 10.0 11.4 10.6 8.2 0 Total Males Females 9th 10th 11th 12th *QNOVWGT - Weighted Data - Based on reference data from the National Health and Nutrition Examination Survey I.
New Jersey High School Survey Percentage of students who described themselves as slightly or very overweight 100 80 60 36.9 32.4 30.5 40 30.1 30.8 30.0 24.8 20 0 Total Males Females 9th 10th 11th 12th QN64 - Weighted Data
New Jersey High School Survey Percentage of students who were trying to lose weight 100 80 61.3 60 46.7 45.4 45.6 44.4 45.5 40 29.9 20 0 Total Males Females 9th 10th 11th 12th QN65 - Weighted Data
New Jersey High School Survey Percentage of students who exercised to lose weight or to keep from gaining weight during the past 30 days 100 80 70.8 68.1 62.1 63.2 61.2 60.9 55.7 60 40 20 0 Total Males Females 9th 10th 11th 12th QN66 - Weighted Data
New Jersey High School Survey Percentage of students who ate less food, fewer calories, or foods low in fat to lose weight or to keep from gaining weight during the past 30 days 100 80 55.7 60 44.4 39.4 38.6 40.4 38.9 40 25.2 20 0 Total Males Females 9th 10th 11th 12th QN67 - Weighted Data
New Jersey High School Survey Percentage of students who went without eating for 24 hours or more to lose weight or to keep from gaining weight during the past 30 days 100 80 60 40 20 13.2 11.1 11.7 9.8 10.0 7.2 6.9 0 Total Males Females 9th 10th 11th 12th QN68 - Weighted Data