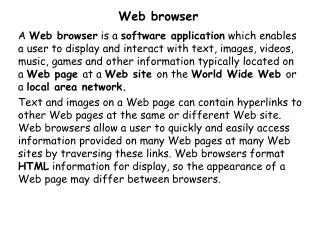
Download
1 / 13
130 likes | 136 Views
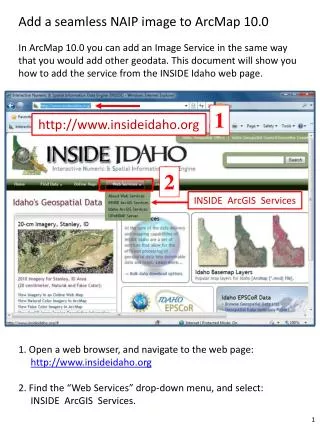
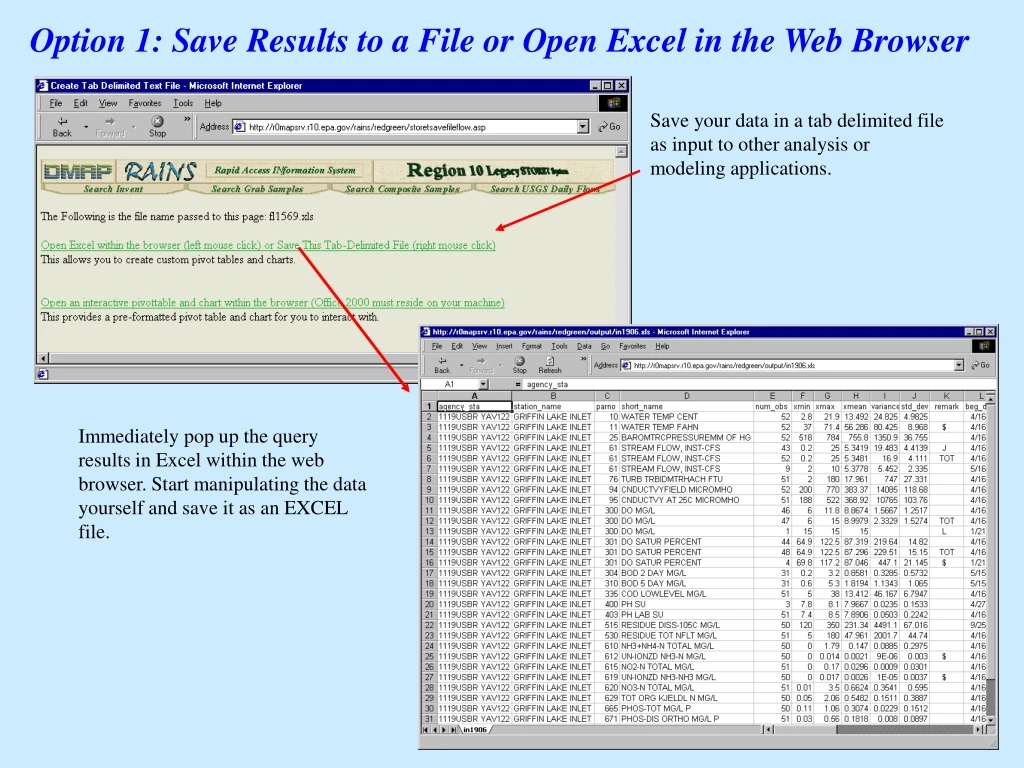
Save your data in a tab delimited file as input to other analysis or modeling applications. Immediately pop up the query results in Excel within the web browser. Start manipulating the data yourself and save it as an EXCEL file. Option 1: Save Results to a File or Open Excel in the Web Browser.

E N D
Save your data in a tab delimited file as input to other analysis or modeling applications. Immediately pop up the query results in Excel within the web browser. Start manipulating the data yourself and save it as an EXCEL file. Option 1: Save Results to a File or Open Excel in the Web Browser
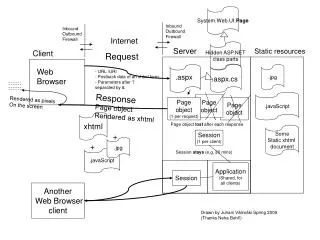
Extract Raw Data From the Grab, Gage or Composite Data Marts Enter through the front page of the System or go from the Invent results page shown on the last slide. Query the raw data here.
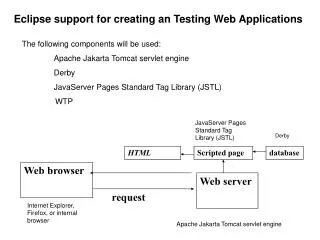
Query the Grab Data Mart Enter the Station ID or Search by HUC, County, Agency, State
Save the results, this time produce dynamic pivot tables and charts within the web browser. Option 2 for saving or analyzing data View the Raw Data Within the Web Browser Results for the Grab or Composite Query Include the following information: Agency, station, parameter name and number, group name, date, numeric value, units, state, sub-basin, county, agency, type, year, water year, water month
Pivot Table Important: Change the pivot table parameters and the graph changes dynamically Option 2: Dynamic Pivot Tables and Charts within the Web Browser These results are from a grab query using the station picked from the mapping app. Y Axis is concentration, X axis is Year and month, so the minimum value of DO and Temp are plotted against time and summarized. See Some Examples:
Analyze the Data for a STORET Station The Pivot Table and Chart Summarize the Raw Data for You These are the same query results as on the previous slide, but now, by manipulating the pivot table --- max values for Flow, DO, and Temp are shown by day. See Another Example:
This pivot table and chart summarize maximum temp values along Lawyer Creek stations, by water year and month. Analyze the Data Within a Sub-Basin, or County This pivot table and chart summarize the count of USGS stream samples at stations in an Idaho sub-basins by water year. These results are from a summary query against the Grab Data Mart Use the same query results, rearrange the pivot table slightly and:
STORET Legacy Data Warehouse • Contents • Three Regions: 4, 9, 10 • 17 States • AL, AK, AZ, CA, FL, GA, GU, HI, ID, KY, MS, NC, NB, OR, SC, TN, WA • Data • Legacy mainframe STORET data redesigned and • stored in a SQL Data Warehouse • Stations 376,744 row • Grab 78,365,016 rows • Composites 3,751,261 rows • INVENT 8,801,544 rows • Database Structure • Star - fact table with related dimension tables • Server • Microsoft SQL Server 2000
STORET Legacy Data Warehouse Purpose of a Data Warehouse Simple structure High-speed access Multidimensional Data Cubes Data mining Cubes Cubes are the main objects in online analytic processing (OLAP), a technology that provides fast access to data in a data warehouse. A cube is a set of data that is usually constructed from a subset of a data warehouse and is organized and summarized into a multidimensional structure Data Mining A mining model enables you to analyze your data for patterns and to make predictions based on the patterns. You can create a mining model from a relational schema or a cube, and you can store output from the model in a tabular column, a cube dimension, or a mining model diagram.
How to Access the Data Warehouse Other Options R10 Mapping Application Direct SQL Queries R10 Query Interface Region10 STORET Legacy Data Warehouse Region 10 Legacy STORET System R10 Pivot Tools Excel, Access, FileMaker, Etc. Thru ODBC Connection Any Custom Built Query Interface
Business Sector (Business Metrics) National Department Stores: For each store in Washington state view women’s clothing revenues (in dollars) by fiscal quarter .Graph the results showing the last 3 years of data. STORET System (Environmental Metrics) Legacy STORET: For each sub-basin in Washington state view temperature data (in centigrade)by water month from all Storet Stations. Graph the results showing the last 3 years of data. The Region 10 STORET Legacy System Is An Environmental Implementation of Proven Business Sector Technology Merged with Interactive Web Mapping • The Technologies : Data Warehousing, OLAP, Web Mapping, and Other Web Technologies • The Data: Legacy STORET data and Geo-referenced Map Layers • EPA Region 10 Software Requirements: • Server-side: Microsoft SQL Server, ESRI ARC/IMS for Mapping, Office 2000 • User-side: • For Display of Non-interactive Tables and Graphs Produced on the Server: A Web Browser • For Web-Enabled Interactive Tables and Graphs: One or More Component of Office 2000 and Internet Explorer 5.0
Region10 Data Warehouse: Future Work • Within One Month: Installation on EPA Intranet Region 10 Production Server • Web Query Interface for Multidimensional Cubes • More Data Mining What We Need: • For External (non-EPA) Web Access : A site with a server outside the EPA firewall to host the system. • Looking for Beta Users to evaluate the system
Select the Mapping Application and provide a station, sub-basin or county for display. This opens the Mapping Application, zoomed and centered on the station which is highlighted in red. Go from the Data Warehouse to a Map