Download
1 / 21
210 likes | 300 Views
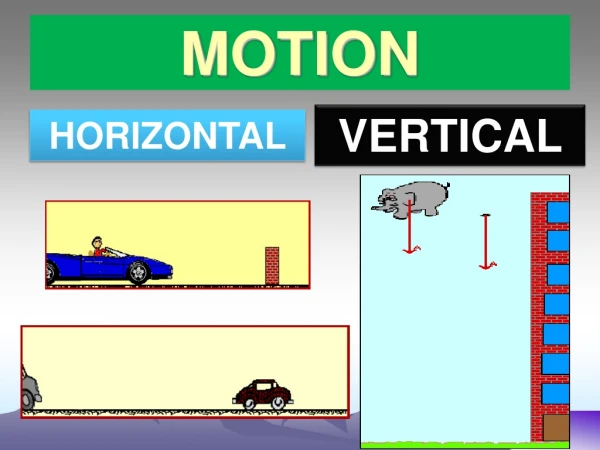
Motion. Science 10. Speed. If 2 people are running a 100 m race, explain how you would know that one person has won. What is the distance that they covered? How does time affect who won? What is speed?. Speed. Speed = distance object moves time it takes S = d t

E N D
Motion Science 10
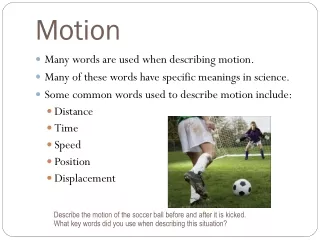
Speed • If 2 people are running a 100 m race, explain how you would know that one person has won. • What is the distance that they covered? • How does time affect who won? • What is speed?
Speed Speed = distance object moves time it takes S = d t *usually expressed in meters (m) second (s) or kilometers (km) hour (hr)
Speed • Do you think that runners in a race go the same speed over the entire distance? • Why do we represent their speed with one number (i.e. 5 m/s)?
Average Speed • The number we often use to represent the speed of an object is called average speed. • Explain why you think scientists’ call this speed “average speed”.
Average Speed vs. Instantaneous • Average speed is a measure of the average distance covered in 1 unit of time (i.e. 1 s, or 1 hr) for the entire distance. • Instantaneous speed is a measure of the speed of an object in the instant it is measured - like a police radar measures.
Speed Lab • Calculate the average speed of your motion for each distance you completed during the lab. • Answer the lab questions on the back of your sheet. • Complete worksheet on calculating speed.
Metric Conversions • Common metric units for distance? • Common metric units for time? • How do we convert between the different size units for a specific measurement? • How do we convert between different units of time?
Graphs • Help communicate information to others regarding a number of variables. • Have independent variables and dependant variables which create an x and y axis. • Help demonstrate the relationship between variables like distance, time and velocity • http://graphs.mathwarehouse.com/distance-time-graph-activity.php • What is represented in this graph?
Slope and speed • The greater the slope of the line created on a distance time graph the greater the speed travelled of greater velocity. • How would you draw the distance time graph for: • Bicycle • Roller blades • Walking
Slope • created by the distance time graph is represented by rise of the graph divided by the run of the graph. This equation is also represents velocity. • Slope = rise divided by run on a distance time graph • S=rise/run
Summary • In summary the speed of an object in motion can be determined for the slope of a distance time graph. • Read section 9.7 pages 362-365 • Answer the Understanding Concepts questions page 365
Section 9.7 – Distance-Time Graphs What is this graph describing? How does distance from the starting point change as time changes for the intervals a, b & c?
Distance-Time Graphs – Card Game Show me a distance–time graph for: • a car travelling at a steady speed; • a car speeding up; • a car slowing down; • a stationary car; • two cars travelling at the same speed towards each other;
Distance-Time Graphs – Card Game Show me a distance–time graph for: • a car is crawling along in the slow lane and a car overtakes • very quickly; • a child runs into the road, so the driver has to make an emergency stop; • a car slows down as it goes over a speed bump, then goes quickly again. Worksheet
Section 9.7 – Distance-Time Graphs • Graphing Activity & Simulation
Acceleration • The change in velocity over a period of time. a = ∆V ∆t units = m s2
Force • The measure of the mass of an object coupled with it’s acceleration. F = ma Units = kg x m s2