Download
1 / 3
40 likes | 202 Views
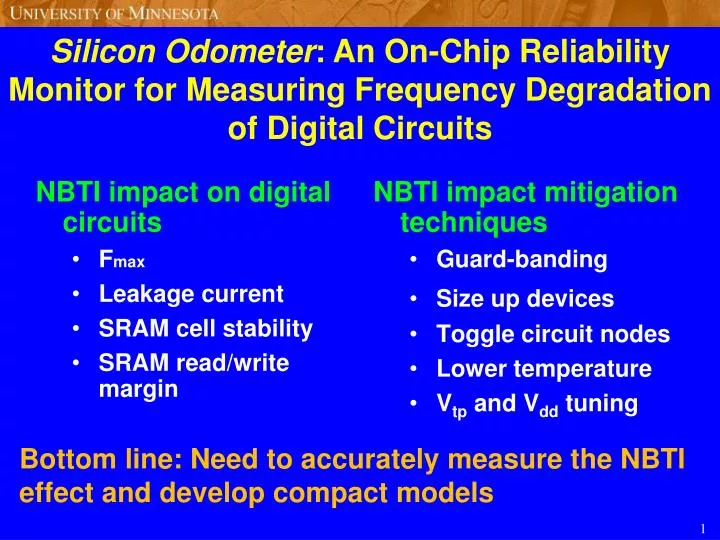
Silicon Odometer : An On-Chip Reliability Monitor for Measuring Frequency Degradation of Digital Circuits. NBTI impact on digital circuits F max Leakage current SRAM cell stability SRAM read/write margin. NBTI impact mitigation techniques Guard-banding Size up devices Toggle circuit nodes

E N D
Silicon Odometer: An On-Chip Reliability Monitor for Measuring Frequency Degradation of Digital Circuits • NBTI impact on digital circuits • Fmax • Leakage current • SRAM cell stability • SRAM read/write margin • NBTI impact mitigation techniques • Guard-banding • Size up devices • Toggle circuit nodes • Lower temperature • Vtp and Vdd tuning Bottom line: Need to accurately measure the NBTI effect and develop compact models
Silicon Odometer (freq=fstress) Stressed ROSC Measurement A ... V DD _ STR C V DD _ NOM Phase B PC _ OUT Comp . 0 V ... (freq=fref - fstress) Stress period (freq=fref) Reference ROSC 120 • Two free running ROSCs for beat frequency detection • Count PC_OUT to determine frequency degradation • Insensitive to environmental variations • High delay sensing resolution • Fully implemented by digital circuits Δ N = 1 @ 1 % ) 100 N ( 99 98 t 80 u p t Δ N = 50 @ 1 % 50 u 60 o r 40 e t n 33 Proposed 20 u o Conventional C 0 0 0 . 5 1 1 . 5 2 Frequency degradation (%)
Summary Measurement work bench Vstress=V0, 30C Labview GUI 0.30% • Fully digital, minimal calibration • Sub-picosecond sensing resolution (<0.02% or <0.8ps) • Microsecond measurement time for minimal recovery (2us) • Applicable as a on-chip reliability monitor 0.25% 0.20% Frequency degradation 0.15% 0.10% 0.05% 0.00% 0 2000 4000 6000 Time (sec)