Download
1 / 1
10 likes | 133 Views
Usage Centric Green Metrics for Storage Doron Chen, Ealan Henis, Ronen Kat and Dmitry Sotnikov IBM Haifa Research Lab. 1. Abstract. 5. Usage Metrics versus Potential Metrics.

E N D
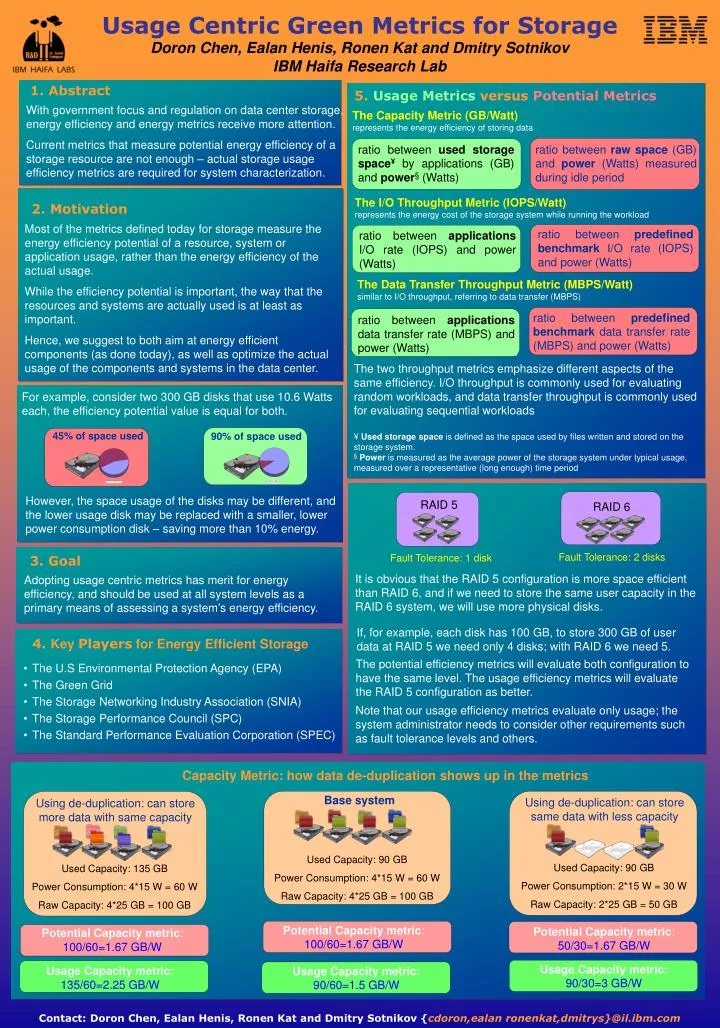
Usage Centric Green Metrics for StorageDoron Chen, Ealan Henis, Ronen Kat and Dmitry SotnikovIBM Haifa Research Lab 1. Abstract 5. Usage Metrics versus Potential Metrics With government focus and regulation on data center storage, energy efficiency and energy metrics receive more attention. Current metrics that measure potential energy efficiency of a storage resource are not enough – actual storage usage efficiency metrics are required for system characterization. The Capacity Metric (GB/Watt) represents the energy efficiency of storing data ratio between used storage space¥by applications (GB) and power§ (Watts) ratio between raw space (GB) and power (Watts) measured during idle period The I/O Throughput Metric (IOPS/Watt) represents the energy cost of the storage system while running the workload. 2. Motivation Most of the metrics defined today for storage measure the energy efficiency potential of a resource, system or application usage, rather than the energy efficiency of the actual usage. While the efficiency potential is important, the way that the resources and systems are actually used is at least as important. Hence, we suggest to both aim at energy efficient components (as done today), as well as optimize the actual usage of the components and systems in the data center. ratio between predefined benchmark I/O rate (IOPS) and power (Watts) ratio between applications I/O rate (IOPS) and power (Watts) The Data Transfer Throughput Metric (MBPS/Watt) similar to I/O throughput, referring to data transfer (MBPS) ratio between predefined benchmark data transfer rate (MBPS) and power (Watts) ratio between applications data transfer rate (MBPS) and power (Watts) The two throughput metrics emphasize different aspects of the same efficiency. I/O throughput is commonly used for evaluating random workloads, and data transfer throughput is commonly used for evaluating sequential workloads ¥ Used storage space is defined as the space used by files written and stored on the storage system. §Power is measured as the average power of the storage system under typical usage, measured over a representative (long enough) time period For example, consider two 300 GB disks that use 10.6 Watts each, the efficiency potential value is equal for both. 45% of space used 90% of space used However, the space usage of the disks may be different, and the lower usage disk may be replaced with a smaller, lower power consumption disk – saving more than 10% energy. RAID 5 RAID 6 Fault Tolerance: 2 disks Fault Tolerance: 1 disk 3. Goal It is obvious that the RAID 5 configuration is more space efficient than RAID 6, and if we need to store the same user capacity in the RAID 6 system, we will use more physical disks. Adopting usage centric metrics has merit for energy efficiency, and should be used at all system levels as a primary means of assessing a system’s energy efficiency. If, for example, each disk has 100 GB, to store 300 GB of user data at RAID 5 we need only 4 disks; with RAID 6 we need 5. 4. Key Players for Energy Efficient Storage The potential efficiency metrics will evaluate both configuration to have the same level. The usage efficiency metrics will evaluate the RAID 5 configuration as better. • The U.S Environmental Protection Agency (EPA) • The Green Grid • The Storage Networking Industry Association (SNIA) • The Storage Performance Council (SPC) • The Standard Performance Evaluation Corporation (SPEC) Note that our usage efficiency metrics evaluate only usage; the system administrator needs to consider other requirements such as fault tolerance levels and others. Capacity Metric: how data de-duplication shows up in the metrics Base system Using de-duplication: can store same data with less capacity Using de-duplication: can store more data with same capacity Used Capacity: 90 GB Power Consumption: 4*15 W = 60 W Raw Capacity: 4*25 GB = 100 GB Used Capacity: 90 GB Power Consumption: 2*15 W = 30 W Raw Capacity: 2*25 GB = 50 GB Used Capacity: 135 GB Power Consumption: 4*15 W = 60 W Raw Capacity: 4*25 GB = 100 GB Potential Capacity metric: 100/60=1.67GB/W Potential Capacity metric: 50/30=1.67GB/W Potential Capacity metric: 100/60=1.67 GB/W Usage Capacity metric:90/30=3GB/W Usage Capacity metric:135/60=2.25GB/W Usage Capacity metric:90/60=1.5 GB/W Contact: Doron Chen, Ealan Henis, Ronen Kat and Dmitry Sotnikov {cdoron,ealan ronenkat,dmitrys}@il.ibm.com