Download
1 / 35
350 likes | 693 Views
Drought, Famine and Measles in Ethiopia 1999-2000. Paul B Spiegel MD, MPH 1 Peter Salama MBBS, MPH 2 Susan Maloney MD, MPH 1 Albertien van der Veen, MSc 3 1 CDC , 2 UNICEF, 3 WHO. Background. Ethiopia subject to recurrent drought and food insecurity exacerbated by civil strife

E N D
Drought, Famine and Measles in Ethiopia1999-2000 Paul B Spiegel MD, MPH1 Peter Salama MBBS, MPH2 Susan Maloney MD, MPH1 Albertien van der Veen, MSc3 1 CDC, 2 UNICEF, 3 WHO
Background • Ethiopia subject to recurrent drought and food insecurity exacerbated by civil strife • Crises generally involve massive excess mortality and population displacement without formation of discrete camps • Prior to crisis of 1999-2000, eastern and southern regions of Ethiopia subject to 3 successive years of drought
Background cont • Beginning in 1999, data from early warning systems in many regions of Ethiopia indicated rapidly deteriorating food security and nutrition situation • More than 10 million people estimated to need food assistance during peak of crisis in early 2000
Mission • Members of IERHB/CDC seconded to UNICEF as Nutrition Technical Advisors June-Sept. 2000 at request of OFDA • Terms of Reference: • Co-ordinate and identify gaps • Provide technical assistance • WHO sent Nutritionist with whom we collaborated closely
Regions of Ethiopia Region
Zone UNDP
WFP Cereal Allocation in April 2002 vs. Requirements by Woreda
<5 Nutrition Surveys in Ethiopia, Jan.-Jun. 2000 Global Acute Malnutrition (GAM) 0-9% 10-19% 20-29% 30-39% 40+% N=38
Ethiopia Nutrition Surveys • Evaluated 125 nutrition surveys from Nov. 1998-Jun. 2000 by 14 different NGOs • RHA*: 16 (13%) • Cluster: 109 (87%) • 42 surveys part of early warning system with different aim and cluster methodology • 67 surveys were “intended” to provide useful data to direct programs * RHA= rapid health assessments using convenience samples
Characteristics of Nutrition Surveys * PPS = proportional to population size + NA=Not applicable
Nutritional Indicators MUAC: mid-upper arm circumference Wt/Ht: weight-for-height
Nutrition Results Global: MUAC <124 mm, wt/ht z-score <–2.0 or % median <80, +/- edema. Moderate: MUAC bw 110 and 124 mm, wt/ht z-scores bw –2.0 and –3.0 or % median bw 70 and <80. Severe: defined as MUAC < 110mm, wt/ht z-score <–3.0 or % median <70, +/- edema.
Evaluation of “Intentional” Surveys • Valid (i.e. representative): • >30 clusters • PPS and • Precise: • >10 children per cluster 1. Binkin N, Sullivan K, Staehling N, Nieburg P. Rapid Nutrition Surveys: How many clusters are enough? Disasters 1995; 16:97-103. 2. Sullivan KM. The effect of sample size on validity and precision in probability proportionate to size cluster surveys, Society of Epidemiologic Research, Utah, 1995
Categorization of Cluster Surveys (N=25) No. of Clusters No. of Children /Cluster
Valid and Precise Cluster Surveys7 of 67 (10.5%) No. of Clusters No. of Children /Cluster
<5 Nutrition Surveys in Ethiopia, Jan.-Jun. 2000 Global Acute Malnutrition (GAM) 0-9% 10-19% 20-29% 30-39% 40+% N=38
<5 Nutrition Surveys in Ethiopia: Jan-Jun 2000 Global Acute Malnutrition (GAM) 0-9% 10-19% 20-29% 30-39% 40+% Valid and Precise: N=2 (5.3%)
USAID Funding for Ethiopia 1999/2000 1999 2000 Development Assistance Food $ 32,264,600 $ 36,200,741 Non-food $ 38,214,000 $ 42,677,000 Total $ 70,478,600 $ 78,877,741 Humanitarian Assistance Food $288,968,022 $ 82,956,723 Non-food $ 11,740,022 $ 1,350,700 Total $300,708,022 $163,185,164 Grand Total $371,186,622 $163,185,164 Source: USAID Ethiopia office 9-01
Problems with Surveys • Sampling Methodology • Sample size inadequate (clusters and/or children) • Non-probabilistic sampling • Not proportional to population size • Targeting of drought-affected areas within woreda • Choosing children most malnourished • Sampling 1 child/household and not weighting sample • Choosing youngest child in household to measure
Problems with Surveys cont B. Survey Analysis: • Nutrition indicators (ER setting) • Wt/Ht z-scores for children <5yrs • 95% CIs using C-sample in EpiInfo • Ensure include edema as cases of severe malnutr. • Weight appropriately if applicable • Measles Immunization coverage • Report % recorded on imm. card and verbal+card (always include measles coverage)
Problems with Surveys cont C. Survey Reporting: • State objectives and detailed methodology • State results clearly with units, including: • Sample size and number of clusters • Number of household refusals or absences • 95% confidence intervals (+/- DEFF) • Interpret results and compare to baseline data or data from previous surveys if available • Make recommendations (underlying causes)
Recommendations Options for NGOs: • ?Make sampling methodology simpler • Improve training manuals • Ensure field staff appropriately trained • Send “HQ staff” to do surveys • Co-ordinate with 1-2 “survey NGOs” in field • Provide survey form templates with programs for data analysis
Recommendations cont Options for policymakers/donors: • Be wary of data/reports provided by NGOs • Have technical persons available (in country vs. contactable elsewhere) to interpret surveys • Field personnel appropriately trained who make decisions based on survey results
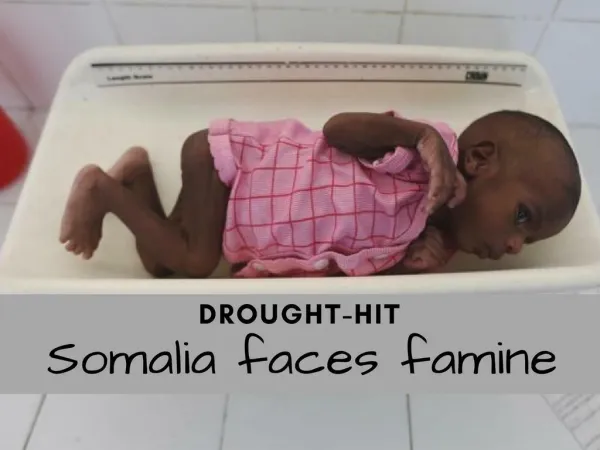
Nutrition and Mortality Survey Gode District, Somali Region, Ethiopia, Aug 2002
Mortality Trends, Gode District Dec. 1999 – Jul. 2000 * Measles MR: per 10,000 < 14 yrs
Mortality Trends, Gode District Dec. 1999 – Jul. 2000 Intervention Begins * Measles MR: per 10,000 < 14 yrs
Causes of Death, All Ages, Gode District Dec. 1999 – Jul. 2000 * ID includes: measles, diarrhea, ARI and malaria (N=293)
Age Distribution for Measles Mortality Gode District, Dec. 1999 – Jul. 2000 N=47 deaths
Acute Malnutrition Prevalence RatesAmong Children 6 months- 4 years (N=867)
Conclusions • Mortality high and sustained • Intervention delayed and inadequate • Malnutrition and infectious diseases major causes of death • Measles important in children 6 mos-4 yrs AND 5-14 yrs • Prevalence of malnutrition high among children
Recommendations • Assess situation rapidly • Implement proven interventions • Basic clinical care including ORS • Measles vaccination 6-59 months • Vaccinate children 5-14 years for measles • Consider different interventions • Community-based feeding to avoid overcrowding