Download
1 / 11
110 likes | 115 Views
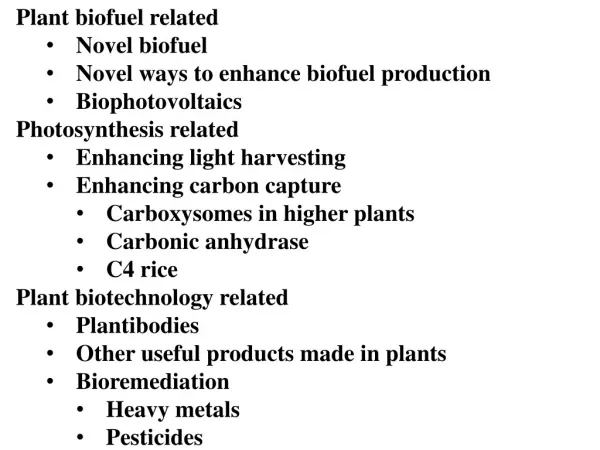
UK approach to calculating biofuel carbon intensity. Expert Meeting Fuel Life Cycle Analysis 17 th July 2007, Brussels Greg Archer, Director, Low Carbon Vehicle Partnership. RTFO commences April 2008, requires suppliers of transport fuels to:

E N D
UK approach to calculating biofuel carbon intensity Expert Meeting Fuel Life Cycle Analysis 17th July 2007, Brussels Greg Archer, Director, Low Carbon Vehicle Partnership
RTFO commences April 2008, requires suppliers of transport fuels to: Sell a given amount of renewable transport fuel each year (for which they will receive certificates); or Purchase certificates from another company; or Pay a “buy-out” price of 22c/l – duty differential of 45c/l retained From start - reporting of the carbon and sustainability (C&S) of biofuels From 2010 – proposed to link issuing of Renewable Transport Fuel Certificates to the carbon intensity of the biofuel From 2011 – proposed to issue certificates only to sustainable biofuels UK biofuel policy is principally designed to deliver GHG savings
UK Renewable Transport Fuel Certificates issued on receipt of a carbon and sustainability report • Reports must be supplied on all fuels produced or imported to UK • Confidential monthly reports on homogeneous batches • Annual aggregate reports published by company • Comparative reports of company performance published by Administrator • Targets for company performance – but no penalties • No exclusions of feedstock/fuel & “Not known” reports permissible • Independent verification of reports & claims
Assessed ex post by Indirect RTFO Administrator land use Boundary for monthly carbon intensity calculation Cultivation & Cultivation & Direct harvest harvest land use Biofuel Feedstock Biofuel transport transport production Waste Waste material material Excludes minor sources, from: Alternative • Manufacture of machinery or equipment waste management • PFCs , HFCs , SF 6 Carbon Intensity calculation boundaries
Flexible system of co-product allocation Substitution DDGS / WDGS Rape meal Soy meal Energy content For energy uses Market value Others Detailed chains calculated for: Ethanol from: sugar cane, sugar beet, wheat and corn Ethanol converted to ETBE FAME biodiesel from: tallow, used cooking oil, palm oil, soy and rapeseed Biomethane from anaerobic digestion of MSW Calculation method (i)
Alternative Waste Management Default values set to zero Companies that can demonstrate alternative waste management may claim credits RTFO Administrator would have to approve a new waste Direct land-use changes (since Nov 05) Only applies to changes from forest or permanent grassland No account of alternative land-use for existing agricultural systems Land use in November 2005 Applies IPCC Tier 1 factors Option to use Tier II / III systems Indirect land-use change Calculated by Administrator Not part of company reporting Fossil fuel reference system Based upon Concawe/EUcar/JRC Chain of custody Mass-balance Data passed through supply chain with purchase invoices Independent annual audit Calculation method (ii)
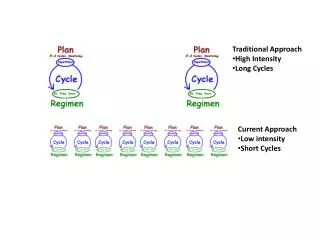
2. Feedstock & Origin defaultse.g. Ethanol – UK, Wheat 3. Chain defaultse.g. Ethanol, - UK, Wheat, CHP Tiered default values and real data used for calculations Conservative defaults Increasing information availability 0. Fuel defaultse.g. Ethanol only Somewhat Conservative defaults 1. Feedstock defaultse.g. Ethanol – Wheat Increased accuracy of calculation Typical defaults 4. Chain calculation e.g Chain default + some actual data
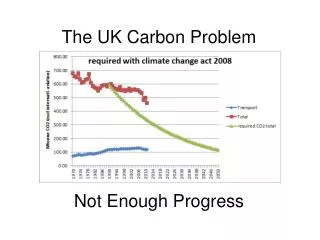
Conclusions • UK approach focused on maximising GHG savings from sustainable biofuels • April 08 reporting of the carbon and sustainability (C&S) of biofuels • From 2010 – proposed to link issuing of Renewable Transport Fuel Certificates to the carbon intensity of the biofuel • From 2011 - exclusion of unsustainable fuels • Carbon intensity calculation includes all significant direct emissions • Flexible system of co-product allocation • Effects of direct, but not indirect land-use change calculated • Flexible data requirements – conservative, high level, default values • Detailed chain calculations for a range of feedstock supplied to the UK • Fossil reference system based upon Concawe data
Any Questions? The Low Carbon Vehicle Partnership +44 (0)20 7304 7040 secretariat@lowcvp.org.uk www.lowcvp.org.uk