Download
1 / 33
330 likes | 332 Views
Learn about FEMA's benefit-cost analysis method for flood hazard mitigation, which helps determine the worth and effectiveness of mitigation projects.

E N D
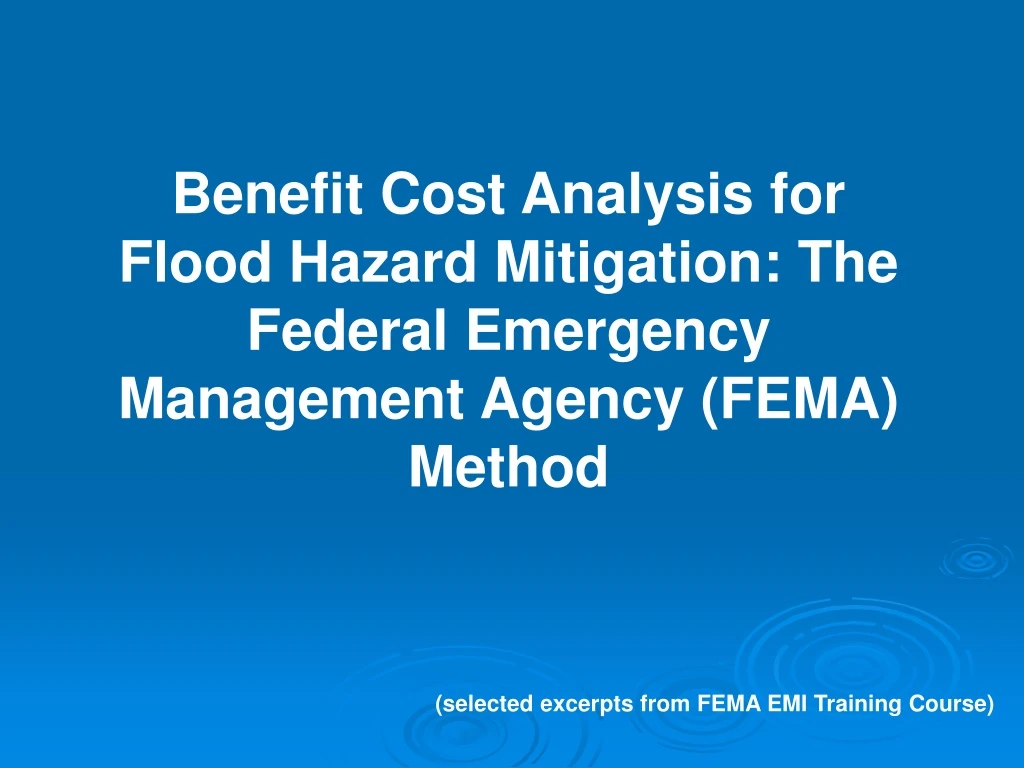
Benefit Cost Analysis for Flood Hazard Mitigation: The Federal Emergency Management Agency (FEMA) Method (selected excerpts from FEMA EMI Training Course)
FEMA does benefit-cost analysis to . . . • Meet the statutory eligibility requirement. • Determine whether or not a project is worth doing. • Have a common basis on which to compare projects. • Show that mitigation works.
Section 404 (a) of the Stafford Act: “The President may contribute up to 75% of the cost of hazard mitigation measures which the President has determined are cost-effective and which substantially reduce the risk of future damage, hardship, loss or suffering in any area affected by a major disaster.”
44 CFR Part 206 Section 206.434 (b) (5) (ii) “The Grantee must demonstrate (that the project is cost effective) by documenting that the project…will not cost more than the anticipated value of the reduction in both direct damages and subsequent negative impacts to the area if future disasters were to occur. Both costs and benefits will be computed on a net present value basis.”
TRUE or FALSE? “All well-designed mitigation projects reduce future damages and losses.”
TRUE or FALSE? “All well-designed mitigation projects reduce future damages and losses.”
TRUE or FALSE? “All well-designed mitigation projects reduce future damages and losses and thus all are cost-effective projects.”
TRUE or FALSE? “All well-designed mitigation projects reduce future damages and losses and thus all are cost-effective projects.”
1.Protect one doghouse or one outhouse? 2. Protect one house that floods infrequently? 3.Protect a flood-prone hospital, city hall, school, and other important buildings? 4.Protect 150 flood-prone houses? Is It Worth $1 Million To . . .? Probably Probably Not
Is It Worth $1 Million To . . .? Probably Probably Not 1.Protect one doghouse or one outhouse? 2. Protect one house that floods infrequently? 3.Protect a flood-prone hospital, city hall, school, and other important buildings? 4.Protect 150 flood-prone houses?
PROPERTY EXPOSED TO FLOODS FLOOD HAZARD (FREQUENCY & SEVERITY) FLOOD RISK (DOLLARS) Probability of Damaging Floods Value and Vulnerability of Property Exposed to Flood Hazard Severity of Threat to the Built Environment Flood Hazard and Flood Risk x =
Mitigation • Mitigation is an action taken specifically to eliminate or reduce the potential for FUTURE damages and losses from the hazard being addressed.
Cost-Effective • Cost-effective means: • The benefits of a hazard mitigation project exceed the costs, or • The benefit-cost ratio is greater than one.
The Benefit-Cost Model “Model” vs. “Modules” TheMODELis theMATH. The economic theory, hazard and risk assessment methods, and mathematical formulas on which FEMA bases the benefit-cost analysis of hazard mitigation projects. TheMODULESare theSOFTWARE. FEMA’s software programs for conducting benefit-cost analysis. The benefit-cost modules are based on the benefit-cost model.
The Benefit-Cost Model BENEFITS = BC RATIO COSTS
Mitigation Project Benefits:Definition • BENEFITS • The expected avoided damages and losses over the lifetime of the mitigation project.
Project BenefitsDirect Damages and Losses Avoided • Damages to buildings and other facilities such as infrastructure • Damages to contents • Loss of function costs • Casualties • Emergency management costs
Project BenefitsIndirect Damages NOT Considered • Changes in gross regional economic product, incomes, or employment • Changes in future economic development or tourism • Criminal justice system costs for disaster- related crime (e.g., looters)
Mitigation Project Benefits • The project benefits calculation is based on four key elements: • Flood frequency and severity • Damages and losses beforemitigation • Damages and losses after mitigation • Economic factors including the discount rate and the mitigation project useful lifetime
100-year flood = 2,310’ 10-year flood = 2,302’ FFE = 2,300’ The Benefit-Cost ModelFlood Frequency and Severity
Mitigation Project Benefits: Damages Before Mitigation Annual Probability ofFlooding Scenario Damages and Losses Expected Annual Damages and Losses Flood Depth (feet) 0 0.2050 $ 6,400 $1,312 1 0.1234 $14,300 $1,765 2 0.0867 $24,500 $2,124 3 0.0233 $28,900 $ 673 4 0.0098 $32,100 $ 315 5 0.0034 $36,300 $ 123 $6,312 Total Expected Annual Damages and Losses
Mitigation Project Benefits: Damages After Mitigation Annual Probability ofFlooding Scenario Damages and Losses Expected Annual Damages and Losses Flood Depth (feet) 0 0.2050 $ 0 $ 0 1 0.1234 $ 0 $ 0 2 0.0867 $ 0 $ 0 3 0.0233 $ 0 $ 0 4 0.0098 $ 6,400 $ 63 5 0.0034 $14,300 $ 49 $112 Total Expected Annual Damages and Losses
Mitigation Project Benefits:Annual Avoided Damages and Losses Expected Annual Damages BeforeMitigation Expected Annual Damages AfterMitigation Expected Annual Avoided Damages and Losses Flood Depth (feet) 0 $1,312 $ 0 $1,312 1 $1,765 $ 0 $1,765 2 $2,124 $ 0 $2,124 3 $ 673 $ 0 $ 673 4 $ 315 $63 $ 252 5 $ 123 $49 $ 74 Totals $6,200 $6,312 $112
The Benefit-Cost ModelEconomics Terminology and Concepts NET PRESENT VALUE The value “today” of money that you will receive in the future. DISCOUNT RATE An interest rate used to determine the time value of money. For Federally funded mitigation projects, the discount rate is determined by the U.S. Office of Management and Budget (OMB).
The Benefit-Cost ModelEconomics Terminology and Concepts • NEVER factor inflation into estimates of future damages or benefits.
The Benefit-Cost ModelEconomics Terminology and Concepts PROJECT USEFUL LIFETIME The estimated time period over which the mitigation project will maintain its effectiveness in preventing or reducing damages and losses from future disasters.
The Benefit-Cost ModelEconomics Terminology and Concepts PRESENT VALUE COEFFICIENT (PVC) The PVC expresses the combined effect of the discount rate and the project useful lifetime on the net present value of future benefits.
Mitigation Project Benefits: Benefit-Cost Analysis Results Net Present Value of Future Benefits Expected Annual Benefits Present Value Coefficient Benefit- Cost Ratio Costs 3.85 $6,200 12.41 $76,942 $20,000 x = $6,200 12 .41 (PVC based on a 30-year project life and 7% discount rate)
0 $1,312 $ 0 $1,312 1 $1,765 $ 0 $1,765 2 $2,124 $ 0 $2,124 3 $ 673 $ 0 $ 673 4 $ 315 $63 $ 252 5 $ 123 $49 $ 74 Benefit-Cost Model Expected Annual Damages BeforeMitigation Expected Annual Damages AfterMitigation Expected Annual Avoided Damages and Losses Flood Depth (feet) Totals $6,312 $112 $6,200 12.41 PVC (7% Discount Rate, 30 years) Net Present Value of Future Benefits $76,942 Costs $20,000 3.85 Benefit-Cost Ratio
The BC Modules • BC Analysis Modules: • Full-Data (FD) • Limited-Data (LD) • Very-Limited-Data (VLD)
FD Module LD Module VLDModule The BC Modules Basis Engineering information and flood hazard data Historic damage data Historic damage data Data Required Site-specific project data and flood hazard data Damage data from 2 or more flood events Damage data from 1 flood event Accuracy Accurate(Most accurate when flood hazard data unavailable) Most Accurate (When flood hazard data available) Least Accurate
Dr. Shane Parson, PE, CFM Senior Project Associate Virginia Tech Center for Geospatial Information Technology 200 Patton Hall Blacksburg, VA 24061 Office: (540) 231-7147 Fax: (540) 231-7532 E-mail: sparson@vt.edu Website: www.cgit.vt.edu