Download

1 / 24
240 likes | 358 Views
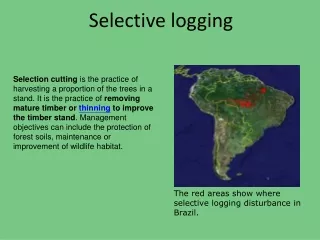
Methods of Validating Maps of Deforestation and Selective Logging. Carlos Souza Jr. souzajr@imazon.org.br. Instituto do Homem e Meio Ambiente da Amazônia—Imazon Caixa Postal 5101, Belém, PA, Brasil CEP 66613-397 Department of Geography – University of California

E N D
Methods of Validating Maps of Deforestation and Selective Logging Carlos Souza Jr. souzajr@imazon.org.br Instituto do Homem e Meio Ambiente da Amazônia—Imazon Caixa Postal 5101, Belém, PA, Brasil CEP 66613-397 Department of Geography – University of California Santa Barbara, California 93106, USA [becky,matzke,carlos,mclark,numata,dar]@geog.ucsb.edu
Workshop Objectives • to propose protocols for ground-based accuracy assessments of remotely sensed estimates of deforestation and selective logged forests. • to address means of establishing error bars and accuracy estimates pertaining to deforestation and selective logging products.
Sampling Design Protocol Accuracy Assessment Response Design Protocol Estimation and Analysis Protocol Protocol for Accuracy Assessment of RS Products Stephen V. Stehman Raymond L. Czaplewski RSE, 1998. 64:331-344
Sampling Design Protocol Accuracy Assessment Response Design Protocol Estimation and Analysis Protocol Sampling Protocol • Sample unit • is a location (point) or an area (pixel or polygon) used to assess the accuracy of a map. • links the map and the reference data. Pixel sampling unit Reference data (Ikonos) Stephen V. Stehman Raymond L. Czaplewski RSE, 1998. 64:331-344
Polygon psu Sampling Design Protocol ssu Accuracy Assessment psu 5x5 pixel block Response Design Protocol Estimation and Analysis Protocol ssu Stephen V. Stehman Raymond L. Czaplewski RSE, 1998. 64:331-344 Sampling Protocol “A scientifically defensible accuracy assessment requires a probability sampling” • Sampling method • Requires an unbiased sample • Simple random • Stratified random • Cluster • Primary (psu) • Secondary (ssu)
Sampling Design Protocol Accuracy Assessment Response Design Protocol Estimation and Analysis Protocol Response Design Stephen V. Stehman Raymond L. Czaplewski RSE, 1998. 64:331-344 • It is a classification scheme applied to the sampling unit. • Labeling protocol • Assigns a land-cover classification to the sampling unit based on the evaluation protocol: • Land cover proportion • Predominant land-cover • Centroid • Multiple land cover classification • Fuzzy classification • Evaluation: • 50% vegetation • 40% bare soil • 10% shrubs • Labeling: • Pasture • Evaluation: • pixel center • Labeling: • Forest
Sampling Design Protocol Accuracy Assessment Producers Accuracy Users Accuracy Response Design Protocol Estimation and Analysis Protocol D = 65/115 = 57% C = 81/100 = 81% AG = 85/115 = 74% SB = 90/104 = 87% D = 65/75 = 87% C = 81/103 = 79% AG = 85/115 = 74% SB = 90/141 = 64% Stephen V. Stehman Raymond L. Czaplewski RSE, 1998. 64:331-344 Estimation andAnalysis Reference Data D C AG SB Row Total 65 4 22 24 115 D Legend 6 81 5 8 100 D – Decidious C – Conifer AG – Agriculture SB - Shrub C Classified Data 0 11 85 19 115 AG 4 7 3 90 104 SB Column Total 75 103 115 141 434 Overall Accuracy = (65+81+85+90)/434 = 74% Source: Congalton and Green (1999)
Sampling Design Flight-line randomly sampled by time-code Cluster samples centered on flight-line Reference sample unit = 30 m x 30 m area Five reference samples recorded per mosaic
Response Design Labeling protocol: dominant land-cover Evaluation: 55% Pasture 45% Secondary Forest Label: “Pasture” 2 1 Evaluation: 100% Pasture Label: “Pasture” 0 Evaluation: 100% Secondary Forest Label: “Secondary Forest” Evaluation: 100% Primary Forest Label: “Primary Forest” 4 3
Randomly select image frames from video based on time code Mosaic and georectify video and overlay cluster samples Five individuals independently interpret video to produce five reference data sets Group (i.e. five interpreters) re-interprets video to generate ‘gold’ reference data set Correct geolocation errors between video mosaics and map Remove mixed samples and edge pixels; identify change Accuracy Assessment Methods and Analysis Interpreter vs. interpreter accuracy Interpreter vs. map accuracy ‘Gold’ reference vs. map accuracy Parameters estimated from error matrices: overall accuracy, producer’s accuracy (omission errors), user’s accuracy (commission errors), Kappa (KHAT) statistics, Kappa variance (for statistical comparisons)
Influence of reference data corrections on map accuracy *statistically different Kappa coefficients (95% confidence level)
Area estimation accuracy assessment 23% 17% 21% 33%
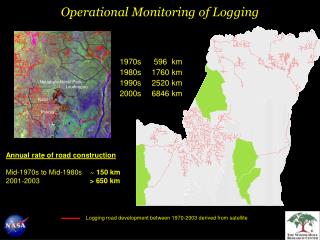
Deforestation Estimates in Acre Area of Forest Fragments: 2864.9 km2
Deforestation Age Are the Fragments “Capoeiras”? Landsat Image Classification (Roberts et al., 2003) Fragments Fragments Forest Classification (INPE - Prodes Digital) Deforestation until 2000 Water Forest – Prodes digital
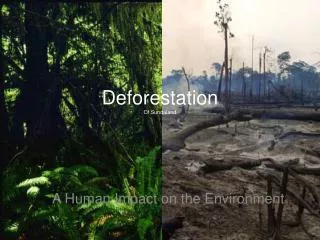
Scale Effect on Mapping Deforestation 9 km 1:50.000 1:250.000
Scale Effect on Mapping Deforestation 9 km 1:250.000 1:50.000
Deforestation by Classes of Size Contribuição p/ o Desmatamento (%) Número de Polígonos Contribuição p/ o Desmatamento (%) Número de Polígonos
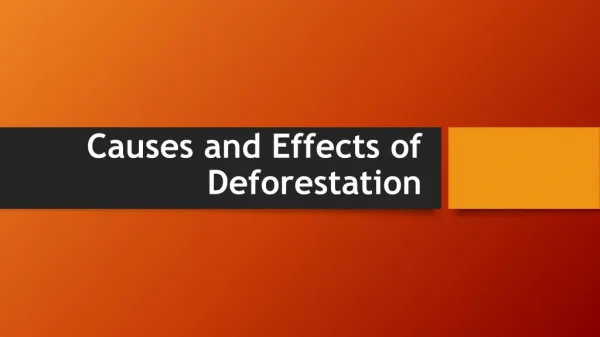
Classification Errors in 2002 Classification Imazon/Imac Classification - Prodes Old deforestation Forest Increment Incremento 2002 - INPE
Accuracy estimates of deforestation and selective logging products • Reference Data • High resolution satellite image • Ikonos • Field data • Several sources
Ikonos Data for LBA-Ecology Study Sites Hurtt et al., (2003)
Proposal • Map accuracy • Sample design: random cluster sampling • Response design: ? • Estimation design: ? • Correct reference data errors • Several research groups interpreting the reference data • Include area estimation accuracy