Download
1 / 1
10 likes | 103 Views
EPSCoR 2011 POSTER TOPIC: Water/Environment Introduction Dissolved organic carbon (DOC) fuels microbial metabolism at the base of food webs and is a dominant carbon flux in streams and rivers, but processes controlling DOC bioavailability are unclear .

E N D
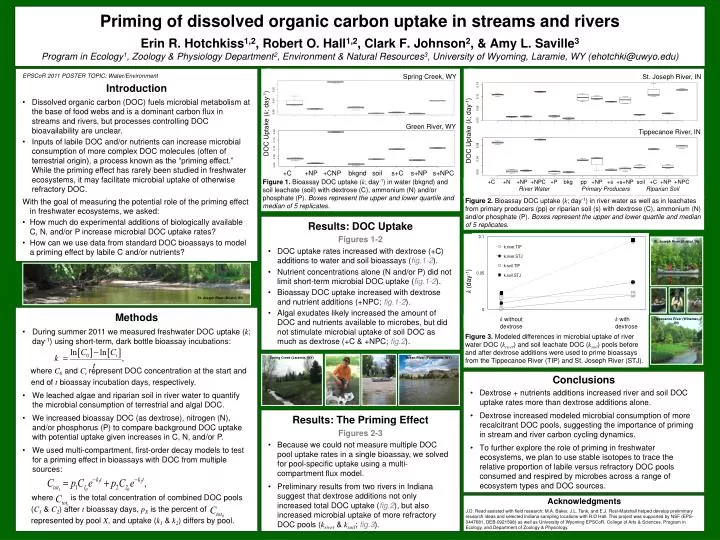
EPSCoR 2011 POSTER TOPIC: Water/Environment • Introduction • Dissolved organic carbon (DOC) fuels microbial metabolism at the base of food webs and is a dominant carbon flux in streams and rivers, but processes controlling DOC bioavailability are unclear. • Inputs of labile DOC and/or nutrients can increase microbial consumption of more complex DOC molecules (often of terrestrial origin), a process known as the “priming effect.” While the priming effect has rarely been studied in freshwater ecosystems, it may facilitate microbial uptake of otherwise refractory DOC. • With the goal of measuring the potential role of the priming effect in freshwater ecosystems, we asked: • How much do experimental additions of biologically available C, N, and/or P increase microbial DOC uptake rates? • How can we use data from standard DOC bioassaysto model a priming effect by labile C and/or nutrients? Spring Creek, WY DOC Uptake (k; day-1) Green River, WY Priming of dissolved organic carbon uptake in streams and riversErin R. Hotchkiss1,2, Robert O. Hall1,2, Clark F. Johnson2, & Amy L. Saville3Program in Ecology1, Zoology & Physiology Department2, Environment & Natural Resources3, University of Wyoming, Laramie, WY (ehotchki@uwyo.edu) +C +NP +CNP bkgnd soil s+C s+NP s+NPC Figure 1. Bioassay DOC uptake (k; day-1) in water (bkgnd) and soil leachate (soil) with dextrose (C), ammonium (N) and/or phosphate (P). Boxes represent the upper and lower quartile and median of 5 replicates. Spring Creek (Laramie, WY) Green River (Fontenelle, WY) • Results: DOC Uptake • Figures 1-2 • DOC uptake rates increased with dextrose (+C) additions to water and soil bioassays (fig.1-2). • Nutrient concentrations alone (N and/or P) did not limit short-term microbial DOC uptake (fig.1-2). • Bioassay DOC uptake increased with dextrose and nutrient additions (+NPC; fig.1-2). • Algal exudates likely increased the amount of DOC and nutrients available to microbes, but did not stimulate microbial uptake of soil DOC as much as dextrose (+C & +NPC;fig.2). St. Joseph River (Bristol, IN) St. Joseph River (Bristol, IN) Conclusions Dextrose + nutrients additions increased river and soil DOC uptake rates more than dextrose additions alone. Dextrose increased modeled microbial consumption of more recalcitrant DOC pools, suggesting the importance of priming in stream and river carbon cycling dynamics. To further explore the role of priming in freshwater ecosystems, we plan to use stable isotopes to trace the relative proportion of labile versus refractory DOC pools consumed and respired by microbes across a range of ecosystem types and DOC sources. • Methods • During summer 2011 we measured freshwater DOC uptake (k; day-1) using short-term, dark bottle bioassay incubations: • where C0 and Ctrepresent DOC concentration at the start and • end of t bioassay incubation days, respectively. • We leached algae and riparian soil in river water to quantify the microbial consumption of terrestrial and algal DOC. • We increased bioassay DOC (as dextrose), nitrogen (N), and/or phosphorus (P) to compare background DOC uptake with potential uptake given increases in C, N, and/or P. • We used multi-compartment, first-order decay models to test for a priming effect in bioassays with DOC from multiple sources: • where is the total concentration of combined DOC pools • (C1 & C2) after t bioassay days, pX is the percent of • represented by pool X, and uptake (k1 & k2) differs by pool. k(day-1) Tippecanoe River (Winamac, IN) k without kwith dextrose dextrose Figure 3. Modeled differences in microbial uptake of river water DOC (kriver) and soil leachate DOC (ksoil) pools before and after dextrose additions were used to prime bioassays from the Tippecanoe River (TIP) and St. Joseph River (STJ). St. Joseph River, IN • Results: The Priming Effect • Figures 2-3 • Because we could not measure multiple DOC pool uptake rates in a single bioassay, we solved for pool-specific uptake using a multi-compartment flux model. • Preliminary results from two rivers in Indiana suggest that dextrose additions not only increased total DOC uptake (fig.2), but also increased microbial uptake of more refractory DOC pools (kriver& ksoil; fig.3). DOC Uptake (k; day-1) Tippecanoe River, IN +C +N +NP +NPC +P bkg pp +NP +s +s+NP soil +C +NP +NPC River Water Primary Producers Riparian Soil Acknowledgments J.D. Reed assisted with field research; M.A. Baker, J.L. Tank, and E.J. Rosi-Marshall helped develop preliminary research ideas and selected Indiana sampling locations with R.O Hall. This project was supported by NSF (EPS-0447681, DEB-0921598) as well as University of WyomingEPSCoR, College of Arts & Sciences, Program in Ecology, and Department of Zoology & Physiology. Figure 2. Bioassay DOC uptake (k; day-1) in river water as well as in leachates from primary producers (pp) or riparian soil (s) with dextrose (C), ammonium (N) and/or phosphate (P). Boxes represent the upper and lower quartile and median of 5 replicates.