Download
1 / 17
170 likes | 175 Views
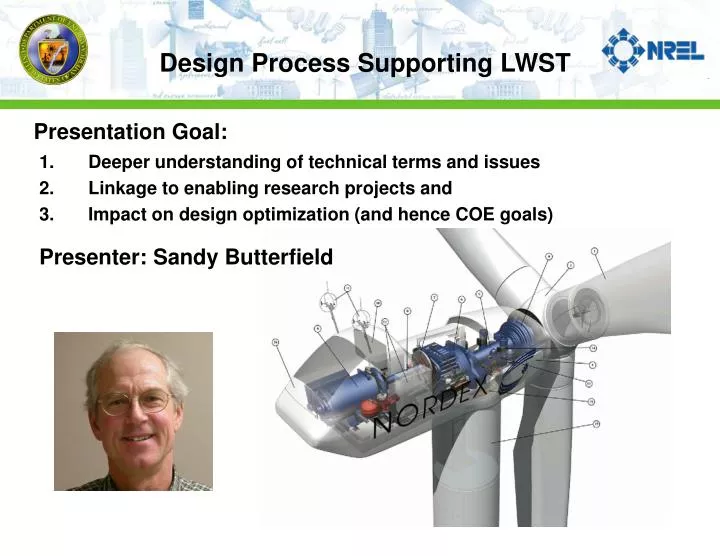
Design Process Supporting LWST. Presentation Goal:. Deeper understanding of technical terms and issues Linkage to enabling research projects and Impact on design optimization (and hence COE goals). Presenter: Sandy Butterfield. Iterative design process.

E N D
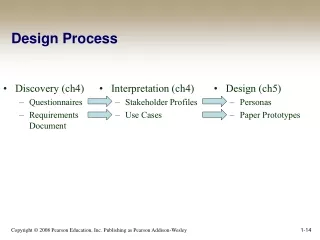
Design Process Supporting LWST Presentation Goal: • Deeper understanding of technical terms and issues • Linkage to enabling research projects and • Impact on design optimization (and hence COE goals) Presenter: Sandy Butterfield
Iterative design process Performed at system level and component level • Full system • Blade • Controller • Drive train Field Test Simulate Design Detail “Tune” Model Analyze Loads
Intimately Linked to all Product Development Phases Design and Analysis Phase Test and Verification Phase Certification Documentation Type Testing Power Performance Dynamic Behavior Noise Safety Test Power Quality Maintenance Manual Installation Manual Operating Manual Personal Safety Manufacturing Quality Design Refinements Type Certification Reliability Tests Load Verification Dynamic Behavior Final Design Performance and Prototype Loads Tests Structural Detailed Design Mech. & Electrical Design Certification Loads Test Detailed Design and Analysis Component Qualification Tests Load Case Analysis Control & Protection System Preliminary Design and Analysis Define Certification Requirements Conceptual Design PRODUCT VALIDATION DESIGN REFINEMENT
System Dynamics (Aeroelastic) Simulation Model Control and Protection System Wind Inflow Model Aero Rotor Dyn Drive Train Structural Loads Support Structure Dynamics Wind Turbine Load Simulators Time series output Modules must interact to capture coupling (mutual influence)
Blade Element Momentum Theory Geometry Blade Element Forces • Relative inflow magnitude? • Relative angle of attack (AOA)? • Rate of change of AOA? • Blade geometry? • Important: • Turbulent inflow • Rotational speed • Pitch angle • Blade deflections & motions • Yaw angle
Synthesized Turbulence • Wind field = U (y,z,t) • Stochastic velocities • Steady wind shear superimposed • Rotational sampling effect increases effective wind fluctuations • Must obey representative turbulence spectra • IEC model? (standard design) • Lamar measurements? (low level jets) • Danish models? (homogeneous)
Wind Modeling Forecasting Models Turbulence Model Energy Spectrum of Wind Speed Fluctuation in the Atmosphere
Idealized flow through a wind turbine rotor represented by a non rotating actuator disk (momentum theory). Steady Aerodynamics Wake is primary indicator of flow conditions at disk plane
Visualization of rotor wake Steady Aerodynamics
Steady, “two dimensional” data used input to simulator. (must be “modified” for unsteady, three dimensional case) Wind Tunnel Airfoil Data Can’t predict Can predict
Cp = P / (0.5**V3*A) where: P = power in [W] = air density in [kg/m3] V = wind speed at hub height in [m/s] A = rotor swept area in [m2] Cp = power coefficient (efficiency) Betz limit - Cp max = 16/27 0.59 Or How do we know they are lying? Good Equation to Know From momentum theory we know: Definition of Power Coefficient
= *R / V where: = tip speed ratio [ ] = rotation speed [rad/s] R = rotor radius [m] V = wind speed at hub height in [m/s] OK, one more useful equation Definition of tip speed ratio (or as my wife used to say the “tip speed and ray show”)
Typical rotor efficiency curves Increasing noise High tip speed ratio rotors = high efficiency & low solidity (blade area/swept area)
Non-stationary Aerodynamic Loads Oblique Inflow Gyroscopic Forces Tower Torsion Yawing Blade Flatwise Deflection Wind Mass Loads Boundary Layer Rolling Pitching Gust Tower Deflection Tower Shadow Blade Edgewise Deflection Centrifugal Forces Blade Torsion Simplified Structural Dynamics • Blade vibrations interact with aerodynamic forces = aeroelasticity • Mode shapes and natural frequencies critical