Download
1 / 46
460 likes | 473 Views
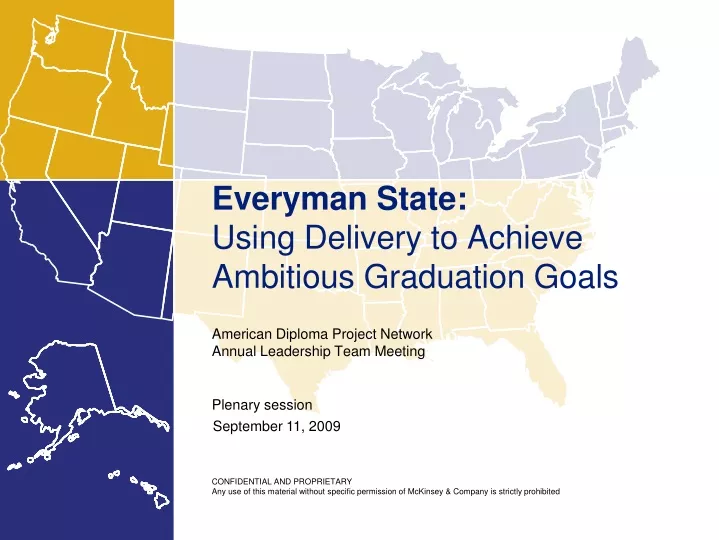
Everyman State: Using Delivery to Achieve Ambitious Graduation Goals. American Diploma Project Network Annual Leadership Team Meeting. Plenary session. September 11, 2009. CONFIDENTIAL AND PROPRIETARY

E N D
Everyman State: Using Delivery to Achieve Ambitious Graduation Goals American Diploma Project Network Annual Leadership Team Meeting Plenary session September 11, 2009 CONFIDENTIAL AND PROPRIETARY Any use of this material without specific permission of McKinsey & Company is strictly prohibited
Contents • Introduction: Delivery, ADP and Everyman State • Setting out: Establishing goals, trajectories and routines • Falling behind: How do we get back on track? • Success: Impact of increased CCR graduates • Conclusion: What can EDI do for you?
7 “ Deliverology”(n.) is a systematic process for driving progress and delivering results. What is “Deliverology?” It will enable you to answer rigorously the following questions: 1 What are you trying to do? How are you planning to do it? At any given moment, how will you know whether you are on track? If not, what are you going to do about it? 2 3 4
NEW college- and career-ready requirements • In order to meet the demands of today’s workforce, all students must graduate with at least: • 4 years of Math, including Algebra I, Geometry, and Algebra II • 4 years of rigorous English • 3 years of Science • 3 years of Social Studies • Graduating college- and career-ready will be a defaultcurriculum • In order to receive course credit, students must pass both the course andthe end-of-course assessment • Previous requirements • All students must graduate with at least these courses: • 2 years of Math, including Algebra I • 3 years of English • 2 years of Science Like all of you, Everyman State has established ambitious college- and career-ready graduation requirements in line with the ADP mission
Everyman State has established ambitious goals for implementation
Like many of you, Everyman State faces demographic and performance challenges in meeting graduation goals 9th grade entry cohort demographics, Class of 2008 Percent of all students Graduation rates, Class of 2008 Percent of each group by graduation type Cohort graduation rate College- and career-ready graduation rate 70 57 58 57 55 49 25 25 24 23 11 All students URM Low-income SPED LEP Total URM Low-income SPED LEP Number of students 99,200 32,900 32,600 10,800 2,600 Cohort graduates 69,800 18,200 18,700 6,300 1,500 CCR graduates 51,600 9,700 10,400 2,500 800
In order to reach its goals, Everyman State will need 91,900 on-time graduates in 2017, and 81,700 college- and career-ready grads Class of 2017 goal Projected 9th grade cohort Required graduates 91,900 90% cohort grads 102,100 81,700 80% CCR grads 102,100 SOURCE: Team analysis
1 Under-represented minorities 9,700 23,100 Low-income 10,400 21,000 0.42 Special Education 2,500 7,000 0.49 Limited English Proficiency 800 3,200 0.51 In order to halve the achievement gap in CCR graduation rates by 2017, Everyman State must focus on struggling populations College- and career-ready graduation rates Class of 2008 CCR grads Ratio to non-disadvantaged student rate Class of 2017 grads required Student subgroup 2017 goal ratio (50% less gap) 0.40 SOURCE: Team analysis
7 First new cohort To stay on track to its 2017 goal, Everyman State plots the graduation targets it must reach each year on its trajectory Number of graduates Cohort goal = 91,900 grads CCR goal = 81,700 grads 70% graduate on time today 49% graduate CCR today 2008 2013 2014 2015 2016 2017 Graduating class SOURCE: Team analysis
7 First new cohort CCR goal = 81,700 Gap to goal = 32,200 Baseline = 49,500 At its current performance levels, Everyman State will fall 32,200 graduates short of its CCR goal Number of graduates 85,000 80,000 75,000 70,000 65,000 60,000 55,000 50,000 45,000 40,000 2008 2013 2014 2015 2016 2017 Graduating class SOURCE: Team analysis
8,700 All existing interventions Currently planned interventions only yield 8,700 additional CCR graduates # of additional CCR grads Impact on leading indicator Intervention Early warning indicators (reduced cumulative dropouts by focusing on 9th and 10th grades) • 45% decrease in cumulative dropout rate 3,900 Saturday Academy (Saturday school for students at risk of passing course but failing EOC test) • 10% increase in pass rates for courses taken during academic year 4,800 SOURCE: Team analysis
7 First new cohort CCR goal = 81,700 Gap to goal = 23,500 Projected CCR withplanned interventions= 58,200 Baseline = 49,500 With these planned initiatives, Everyman State will fall 23,500 graduates short of the necessary trajectory to reach the CCR goal Number of graduates 85,000 80,000 75,000 70,000 65,000 60,000 55,000 50,000 45,000 40,000 2008 2013 2014 2015 2016 2017 Graduating class SOURCE: Team analysis
Againsthistory Againstorganizations with similar processes Within your systems Againstthe world Againstother similar systems Everyman State uses five types of benchmarking to learn about other ways to build a trajectory that will reach its goal
Course passage rates Percent Fourth-Year Math Algebra I Geometry Algebra II CCR graduates Math EOC tests • Not part of a subgroup 75-80 • URM, LI, LEP, SPED 25-30 To close the gap, Everyman State looked at its system and realized that several demographic groups were struggling to pass core CCR courses SOURCE: Team analysis
Fourth-Year Math Algebra I Geometry Algebra II • URM, LI, LEP, SPED 30-35 With extended learning time, Everyman State gains 3,600 additional CCR graduates by 20171 Everyman State looked at other states and learned that using ELT to target support at these students could add 3,600 CCR graduates in 2017 Course passage rates Percent CCR graduates Math EOC tests • Not part of a subgroup 75-80 1 Overall impact on system; rates based on 50% improvement in select Math, 15% in English, 33% of failing students; affects year passage rates only. SOURCE: Team analysis
Number ofadditionalCCR grads Intervention Impact on leading indicator 8th grade planning (guidance counselor initiative) • 100% on-track 9th grade enrollment by 2013 • 20% decrease in off-track/continuing rate 3,900 90% summer school enrollment • 90% enrollment in summer CCR courses when year course is failed 5,100 9th grade readiness (Alg 1 and writing) • Increase in Alg 1 and Eng 1 pass rates by 9th grade class of 2017 • 40% year course, 25% summer (SPED) • 30% year course, 15% summer (URM, LI, LEP) • 10% year course, 5% summer (All others) 700 Early college high school • 20% decrease in dropout rate • 30% decrease in off-track/continuing rate 6,000 Mid-career math recruitment (50% lowest-performing schools) • 15% improvement in math year course pass rates 100 Extended time for bottom 33% of schools (ELT) • 50% increase in math year course rates • 15% increase in English year course rates 3,600 Literacy remediation • 75% decrease in failures of English year courses 5,100 24,500 Total Through similar analyses, Everyman State identified severalother interventions to close the gap to its goal SOURCE: Team analysis
7 CCR goal = 81,700 82,700 First new cohort Literacy remediation = 5,1002 77,700 Extended time = 3,6002 72,600 Mid-career math recruitment = 1001 Early college high school = 6,000 67,400 9th-grade readiness = 700 90% summer school = 5,100 62,000 8th grade planning = 3,900 Planned interventions = 8,700 Baseline = 49,500 With these new interventions, Everyman State has a series of plans that it believes will get carry it to its college- and career-ready goal for 2017 Number of graduates 85,000 80,000 75,000 70,000 65,000 60,000 55,000 50,000 45,000 40,000 2008 2013 2014 2015 2016 2017 Graduating class 1 Impact masked by students’ failing English sequence 2 Includes impact of other initiatives SOURCE: Team analysis
7 Low trajectory (policy has a lagged impact) High trajectory (policy has an immediate impact) Trajectories are not necessarily straight lines, because the timing and size of your interventions may vary Sample policy trajectories Performance Historical performance Starting point Long-term strategic goal Time
Monthly notes • Monthly note to the CSSO with a briefing on delivery progress SEA stocktakes • Quarterly meeting between CSSO and relevant SEA leaders to regularly assess each planned intervention District stocktakes • Quarterly meeting between CSSO and leaders of major districts to regularly assess progress Delivery reports • Semi-annual assessment of the status of all of the system’s targets and underlying interventions Everyman State also develops a schedule of regular routines to monitor progress Definition
Rationale summary Recent performance against trajectory and milestones Likelihood of delivery Red Highly problematic – requires urgent and decisive action Yellow/Red Problematic – requires substantial attention, some aspects need urgent attention Yellow/Green Mixed – aspect(s) require substantial attention, some good Green Good – requires refinement and systematic implementation Everyman State uses this assessment framework to routinely assess progress on each intervention Judgement Rating L / M / H / VH Degree of challenge Quality of planning, implementation and performance management Capacity to drive progress 1 / 2 /3 / 4 Stage of delivery
Early Warning Indicators Saturday Academy 8th-grade planning 90% Summer school enrollment 9th-grade readiness Early college high school Mid-career math recruiting Extended time Literacy remediation Everyman State uses a summary table of assessments to track progress on all of its interventions Assessment criteria Overall judgment Quality of planning,implementation andperformance mgmt. Degree of challenge Capacity todrive progress Stage ofdelivery Likelihoodofdelivery Program Rank
Discussion 1: Goals, trajectories and routines • Q1. How useful would this process of trajectory setting and creating routines be in reaching your college- and career-readiness goals? • Have you conducted a similar process of goal-setting and trajectory-setting? Why or why not? • Do you have access to the necessary information to draw useful conclusions from this type of exercise? • Q2. How challenging would trajectory building and establishing similar routines be in your state? • What would be the biggest barriers to building a trajectory and establishing routines in your system? • Do you have the capacity or capability in your system to perform the required data analysis? To oversee progress? • Do system leaders have the time and ability to prioritize these activities given competing demands?
Goals, trajectories and routines: Time to vote!Howusefulwould this process of trajectory setting and creating routines be in reaching your college- and career-readiness goals? • “Not useful at all" • “Possibly useful – need to know more” • “Probably useful – want to know more” • “Definitely useful”
Goals, trajectories and routines: Time to vote!How challenging would trajectory building and establishing similar routines be in your state? • “Impossible” • “Very challenging” • “Somewhat challenging” • “Not challenging at all”
Contents • Introduction: Delivery, ADP and Everyman State • Setting out: Establishing goals, trajectories and routines • Falling behind: How do we get back on track? • Success: Impact of increased CCR graduates • Conclusion: What can EDI do for you?
7 Required trajectory Current trajectory First new cohort CCR goal = 81,700 Projected off-track = 75,600 Gap to goal = 6,100 Actual 2013 graduates When the Class of 2013 graduates, Everyman State realizes it is already off-track to its CCR goal for 2017 Number of graduates 85,000 80,000 75,000 70,000 65,000 60,000 55,000 50,000 45,000 40,000 2008 2013 2014 2015 2016 2017 Graduating class SOURCE: Team analysis
A review of progress shows mixed results amongst the interventions Assessment criteria Overall judgment Planning, perform. mgmt. Capacitytodriveprogress Degree of challenge Stage ofdelivery Likelihoodofdelivery Program Rank Justification Mid-career math recruitment Successful as expected in early stages of recruitment Medium 1 Well-received and some decrease in dropouts; need to benchmark rigor of programs Medium 1 Early college high school Results as expected; some improvements needed in enforcement/performance mgmt. 90% summer school enrollment Low 2 Extremely effective where implemented; some need for additional counselor capacity High 2 8th-grade planning Results as expected in early stages of implementation, especially in English II scores High 1 Literacy remediation Significant gains in student achievement in all classes by 9th grade measures Med-Low 2 9th-grade readiness Enrollment used as enrichment; need to communicated intended beneficiaries Med-Low 3 Saturday Academy Insufficient teacher capacity; impact is only 25% increase in math scores Med-High 1 Extended time Dropout rate has not changed at all; needs further attention High 3 Early Warning Indicators
Judgement Rating Rationale summary Recent performance against trajectory and milestones Med-Low • Program effective; only requires accurate targeting of students Degree of challenge • At all levels, ineffective communication has led to targeting wrong students for Saturday program. Program used as enrichment, not intervention Quality of planning, implementation and performance management Likelihood of delivery • Educator and administrative capacity is sufficient • Need to develop and emphasize process for identifying at-risk students who should be placed in this program Capacity to drive progress 3 • Advanced; in place for over 3 years Stage of delivery Solution: Communication plan and diagnostic testing Red Highly problematic – requires urgent and decisive action Yellow/Red Problematic – requires substantial attention, some aspects need urgent attention Yellow/Green Mixed – aspect(s) require substantial attention, some good Green Good – requires refinement and systematic implementation The reduced impact of Saturday Academies is due to miscommunication of the program as an enrichment service
Judgement Rating Rationale summary Recent performance against trajectory and milestones Med-High • Extended time costly and success depends on quality of teachers Degree of challenge • Structure and funding exist • Need for improved performance management to identify lower-than-projected gains earlier in cohort progression through CCR sequences Quality of planning, implementation and performance management Likelihood of delivery • Quality of teaching, certification and tenure of teachers at ELT schools are below peer schools, leading to reduced student gains Capacity to drive progress 1 • Beginning; implemented beginning in 2011 Stage of delivery Solution: Recruit better teachers and incentivize to teach at ELT schools Red Highly problematic – requires urgent and decisive action Yellow/Red Problematic – requires substantial attention, some aspects need urgent attention Yellow/Green Mixed – aspect(s) require substantial attention, some good Green Good – requires refinement and systematic implementation The reduced impact of extended time is due to absence of excellent educator capacity to teach in ELT schools
Judgement Rating Rationale summary Recent performance against trajectory and milestones High Degree of challenge • Cause of dropout rate is unknown • Dropout rate of traditionally at-risk students has actually declined but overall dropout rate has not • Performance management system offers no explanation Quality of planning, implementation and performance management Likelihood of delivery • Educator capacity to identify Early Warning indicators and support at-risk students is above levels of peer systems Capacity to drive progress 3 • Advanced; in place for over 3 years Stage of delivery Solution: ? Red Highly problematic – requires urgent and decisive action Yellow/Red Problematic – requires substantial attention, some aspects need urgent attention Yellow/Green Mixed – aspect(s) require substantial attention, some good Green Good – requires refinement and systematic implementation The reason for the consistently high dropout rate is unclear and merits further investigation
Discussion 2: Problem-solving and resolution • Q3. How well-equipped is your state to resolve significant problems where you cannot identify the root of the issue? • Do you have processes or systems in place for problem-solving? • What information do you need? Which people are critical to resolving the problem? • Do you face challenges in gathering and analyzing information? • Do you face challenges in prioritizing difficult issues over competing demands? Q4. What is the biggest barrier to problem-solving?
Problem-solving and resolution: Time to vote! How well-equipped is your state to resolve such problems? • “Not at all – it would be impossible” • “Poorly equipped” • “Somewhat equipped” • “Well-equipped”
Problem-solving and resolution: Time to vote! What is the biggest barrier to problem-solving? • “Lack of capacity” • “Limited access to and/or poor quality of data” • “Competing priorities” • “Inadequate systems and processes”
Conducting a priority review For maximum impact, a problem-solving process should include these key steps: Identify problem Initial analysis of dataand evidence Identify delivery chain and structure issues Generate initial hypotheses Generate interview questions Field work Analyze evidence and structure solutions Agree on key actions
After conducting a priority review, Everyman State finds existing programs do not address “new dropouts,” who need support for CCR classes Surveys identify that primary reason for dropping out is lack of academic support Interviews and front-line visits support data that “new dropouts” need support for CCR courses Can’t get academic support • Students with traditional drop-out profiles (disinterested, unprepared) have decreased 25% since the Early Warning indicator intervention • Students dropping out today do not match profiles of traditional dropouts (better prepared for high school, find classes interesting) • “New” dropouts report feeling sense of failure and desire for increased support • Most “new” dropouts tend to leave after passing 1-2 years of CCR curriculum and struggling with later courses Family/personal reasons Classes aren’t interesting Primary reason for dropout Percent of dropouts SOURCE: Team analysis
% Class of 2013 Class of 2014 Dropout rate Percent of entry cohort -11% 22 -21% 21 -10% Expected decrease in cumulative dropouts Percent 20 20 18 Leading indicators impacted 17 Pilot program Graduation coaches • 11th-12th grade dropouts, URM 20 Skills preparatory camp • 9-10th grade dropouts, URM 15 AVID • All dropouts, URM 25 Graduation coaches Montgomery District Skills preparatory camp Allegheny District AVID Lane District Everyman State decides to pilot three academic support initiatives it believes will prevent “new dropouts” in large districts 2013-2014 SOURCE: Team analysis
The following year (2014-2015), Everyman State rolls out the highly successful AVID program system-wide Decrease in dropout rate, 2013-2015 Percent Individual district performance • In the subsequent school year (2015-2016) Everyman State uses, “leader districts” to improve “laggard districts,” further increasing the impact of the new dropout intervention: • Teacher, principal and superintendent exchanges • Best practice workshops • Identification of key implementation barriers • Peer sharing “Leader districts” “Laggard districts” Dropout rate, Class of 2013 Percent of cohort SOURCE: Team analysis
Projected with interventions = 82,600 First new cohort CCR goal = 81,700 With its new dropout intervention, Everyman State truly believes it can get back on track to its 2017 goal Number of graduates 85,000 80,000 Projected off-track =79,500 75,000 70,000 65,000 60,000 55,000 50,000 45,000 40,000 2008 2013 2014 2015 2016 2017 Graduating class SOURCE: Team analysis
Contents • Introduction: Delivery, ADP and Everyman State • Setting out: Establishing goals, trajectories and routines • Falling behind: How do we get back on track? • Success: Impact of increased CCR graduates • Conclusion: What can EDI do for you?
First new cohort By 2017, with continued monitoring and problem solving, Everyman State reaches its goal, and manages to halve the achievement gap Number of graduates Cohort grads = 92,000 grads CCR grads = 82,600 2008 2013 2014 2015 2016 2017 Graduating class SOURCE: Team analysis
College enrollment by Class of 2017 Number of students 6-year degree attainment by Class of 2017 Number of graduates 73,800 50,400 12,300 13,300 9,500 52,000 33,300 3,800 Baseline (enrollment from baseline grads) Increased graduates (enrollment of additional cohort grads) Increased CCR graduates (enrollment of increased CCR grads) Total Baseline (completion by baseline grads) Increased graduates (completion by additional cohort grads) Increased CCR graduates(completion by increased CCR grads) Total The increase in Cohort and CCR graduation rates in Everyman State increases college enrollment and completion This increase in college graduatesin the workforce increases GDP by $7 bn over the lifetime of the Class of 2017 high school graduates SOURCE: Strong American Schools, Diploma to Nowhere, 2008; BLS 2008; Census 2007; Chicago Public Schools 2008; Indiana Core 40; Role of Community Colleges in Florida’s Economy, 2004 (see Appendix for further details)
Imagine what this would look like in your state. After 5 years of relentlessly striving and problem-solving toward its high-school graduation goals, Everyman State added 43,000 high school graduates,17,000 college graduates and significantly boosted its economy.
Contents • Introduction: Delivery, ADP and Everyman State • Setting out: Establishing goals, trajectories and routines • Falling behind: How do we get back on track? • Success: Impact of increased CCR graduates • Conclusion: What can EDI do for you?
Mission • The mission of the USEDI is to develop the capacity of K-12 and higher education leaders to define and deliver on their key education priorities, so that intent at the system level translates to impact at the student level Major functions • Provide direct support to participating systems to build their capacity to deliver • Connect participating systems in a collaborative learning network • Build a knowledge base of best practices and “case stories” of delivery Partners • The Education Trust • Achieve Support • Michael Barber (leadership) • McKinsey & Company The U.S. Education Delivery Institute (USEDI) will build the “capacity to deliver” of state-level K-12 and higher education systems