Download
1 / 33
330 likes | 379 Views
UNIT 3: Energy Changes and Rates of Reaction. Chapter 6: Rates of Reaction. UNIT 3. Chapter 6: Rates of Reaction.

E N D
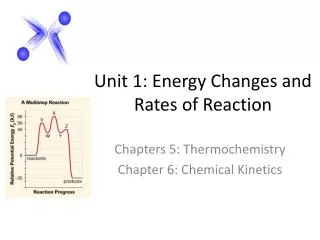
UNIT 3: Energy Changes and Rates of Reaction Chapter 6: Rates of Reaction
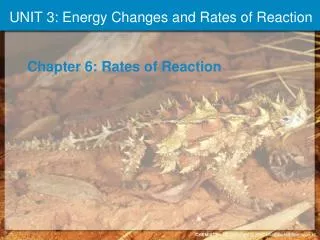
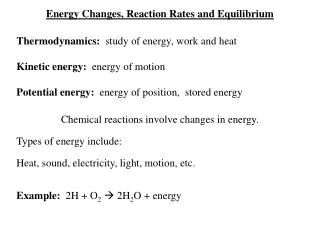
UNIT 3 Chapter 6: Rates of Reaction An important part of studying chemical reactions is to monitor the speed at which they occur. Chemists look at how quickly, or slowly, reactions take place and how these rates of reaction are affected by different factors. The light produced by a firefly depends on the speed of a particular chemical reaction that occurs in its abdomen.
UNIT 3 Section 6.1 6.1 Chemical Reaction Rates Chemical kinetics is the study of the rate at which chemical reactions occur. • The term reaction rate, or rate of reaction refers to: • the speed that a chemical reaction occurs at, or • the change in amount of reactants consumed or products formed over a specific time interval
UNIT 3 Section 6.1 Determining Reaction Rates The reaction rate is often given in terms of the change in concentration of a reactant or product per unit of time. The change in concentration of reactant A was monitored over time.
UNIT 3 Section 6.1 Determining Reaction Rates The change in concentration of reactant or product over time is often graphed. For the reaction A → B, over time, the concentration of A decreases, and the concentration of B increases.
UNIT 3 Section 6.1 Average and Instantaneous Reaction Rates • Average rate of reaction: • change in [reactant] or [product] over a given time period (slope between two points) • Instantaneous rate of reaction: • the rate of a reaction at a particular point in time (slope of the tangent line) Average rate of reaction and instantaneous rate of reaction can be determined from a graph of concentration vs. time.
UNIT 3 Section 6.1 Expressing Reaction Rates in Terms of Reactants or Products A known change in concentration of one reactant or product and coefficients of a chemical equation allows determination of changes in concentration of other reactants or products.
UNIT 3 Section 6.1 Express the rate of formation of ammonia relative to hydrazine, for the reaction on the previous slide.
UNIT 3 Section 6.1 The mole ratio of ammonia to hydrazine is 4:3
UNIT 3 Section 6.1 Methods for Measuring Rates of Reaction
UNIT 3 Section 6.1 Calculating Reaction Rates from Experimental Data The following data were collected in order to calculate the rate of a reaction. Calculations on the next two slides show how to use volume data and mass data to determine the average rate of a reaction.
UNIT 3 Section 6.1 Calculating Reaction Rates from Experimental Data
UNIT 3 Section 6.1 Calculating Reaction Rates from Experimental Data
UNIT 3 Section 6.2 6.2 Collision Theory and Factors Affecting Rates of Reaction According to collision theory, a chemical reaction occurs when the reacting particles collide with one another. Only a fraction of collisions between particles result in a chemical reaction because certain criteria must be met.
UNIT 3 Section 6.2 Effective Collision Criteria 1:The Correct Orientation of Reactants For a chemical reaction to occur, reactant molecules must collide with the correct orientation relative to each other (collision geometry). Five of many possible ways that NO(g) can collide with NO3(g) are shown. Only one has the correct collision geometry for reaction to occur.
UNIT 3 Section 6.2 Effective Collision Criteria 2:Sufficient Activation Energy For a chemical reaction, reactant molecules must also collide with sufficient energy. Activation energy, Ea, is the minimum amount of collision energy required to initiate a chemical reaction. Collision energy depends on the kinetic energy of the colliding particles.
Maxwell-Boltzmann distribution curve • Plot of # of collisions of particles at given T against the kinetic energy of each cure The shaded part of the Maxwell-Boltzmann distribution curve represents the fraction of particles that have enough collision energy for a reaction (ie the energy is ≥ Ea).
UNIT 3 Section 6.2 Representing the Progress of a Chemical Reaction • From left to right on a potential energy curve for a reaction: • potential energy increases as reactants become closer • when collision energy is ≥ maximum potential energy, reactants will transform to a transition state • products then form (or reactants re-form if ineffective) Exothermic Endothermic
UNIT 3 Section 6.2 Activation Energy and Enthalpy • The Ea for a reaction cannot be predicted from ∆H. • ∆H is determined only by the difference in potential energy between reactants and products. • Ea is determined by analyzing rates of reaction at differing temperatures. • Reactions with low Ea occur quickly. Reactions with high Ea occur slowly. Potential energy diagram for the combustion of octane.
Activated complex – chemical species that occurs in the transition state at the top of the activation energy barrier; the activeted complex is temporary while bonds are breaking and new ones are forming (unstable)
UNIT 3 Section 6.2 Activation Energy for Reversible Reactions • Potential energy diagrams can represent both forward and reverse reactions. • follow left to right for the forward reaction • follow right to left for the reverse reaction
UNIT 3 Section 6.2 Analyzing Reactions Using Potential Energy Diagrams The BrCH3 molecule and OH- collide with the correct orientation and sufficient energy and an activated complex forms. When chemical bonds reform, potential energy decreases and kinetic energy increases as the particles move apart.
UNIT 3 Section 6.2 Describe the relative values of Ea(fwd) and Ea(rev) for an exothermic reaction
UNIT 3 Section 6.2 Ea(rev) is greater than Ea(fwd)
UNIT 3 Chapter 6: Rates of Reaction Section 6.3 6.3 Reaction Rates and Reaction Mechanisms Initial rate is the rate of a chemical reaction at time zero. • products of the reaction are not present, so the reverse reaction cannot occur • it is a more accurate method for studying the relationship between concentration of reactant and reaction rate Initial rate is found by determining the slope of a line tangent to the curve at time zero. TO PREVIOUS SLIDE
UNIT 3 Chapter 6: Rates of Reaction Section 6.3 Graphing Reaction Rate in Terms of Concentration • To study the effects of concentration on reaction rate: • different starting concentrations of reactant are used • initial rates are calculated using the slopes of the tangent lines from concentration vs time curves • initial rates are plotted against starting concentration Initial rates are determined (A) and these are plotted against concentration (B). TO PREVIOUS SLIDE
UNIT 3 Chapter 6: Rates of Reaction Section 6.3 First-order Reactions The initial rate vs starting concentration graph on the previous slide is a straight line. • the equation of the line can be expressed as: rate = k[A] • This represents a first-order reaction • For reactions with more than one reactant (e.g. A and B): • if experiments for each reactant produce straight lines, the rate is “first order with respect to reactant A and first order with respect to reactant B.” TO PREVIOUS SLIDE
UNIT 3 Chapter 6: Rates of Reaction Section 6.3 Second-order Reactions • For chlorine dioxide in this reaction: • the initial rate vs concentration curve is parabolic • the reaction is proportional to the square of [ClO2] • it is a second order reaction with respect to this reactant rate = k[A]2 TO PREVIOUS SLIDE
UNIT 3 Chapter 6: Rates of Reaction Section 6.3 The Rate Law The rate law shows the relationship between reaction rates and concentration of reactants for the overall reaction. rate = k[A]m[B]n m: order of the reaction for reactant A n: order of the reaction for reactant B k: rate constant m + n: order of the overall reaction TO PREVIOUS SLIDE
UNIT 3 Chapter 6: Rates of Reaction Section 6.3 Reaction Mechanisms A reaction mechanism is the series of elementary steps that occur as reactants are converted to products. For example, oxygen and nitrogen are not formed directly from the decomposition of nitrogen dioxide: It occurs in two elementary steps: TO PREVIOUS SLIDE
UNIT 3 Chapter 6: Rates of Reaction Section 6.3 The Rate-determining Step This reaction occurs in three elementary steps: • Step 2 is the rate-determining step: • it is the slowest elementary step • the overall rate of the reaction is dependent on this step • the Eafor this step is higher than Ea for each of the other steps TO PREVIOUS SLIDE
UNIT 3 Chapter 6: Rates of Reaction Section 6.3 A Proposed Reaction Mechanism • Experiments show that this reaction is zero order with respect to OH–(i.e. its rate does not depend on [OH–]) • This can be explained by a two-step mechanism Step 2 is very fast and depends on completion of Step 1, not on the concentration of OH–. TO PREVIOUS SLIDE
UNIT 3 Chapter 6: Rates of Reaction Section 6.3 Section 6.3 Review TO PREVIOUS SLIDE