Download

1 / 54
540 likes | 550 Views
Irrigation Scheduling and Soil Moisture Monitoring. Steve A. Miller Biosystems and Agricultural Engineering Michigan State University mill1229@msu.edu http://www.egr.msu.edu/bae/water/. Irrigation Scheduling.

E N D
Irrigation Scheduling andSoil Moisture Monitoring Steve A. Miller Biosystems and Agricultural Engineering Michigan State University mill1229@msu.edu http://www.egr.msu.edu/bae/water/
Irrigation Scheduling • Process of maintaining an optimum water balance in the soil profile for crop growth and production • Irrigation decisions are based on an accounting method on the water content in the soil
Why Use Irrigation Scheduling? • Prevent stress – health of plant; yield loss; appearance • Maximize water use efficiency – beneficial use of resource • Minimize leaching of nitrates or pesticides
Right to Farm GAAMPsIrrigation Scheduling Irrigation scheduling for each unit or field is an integral part of GAAMPs Irrigation scheduling is the process of determining when it is necessary to irrigate and how much water to apply Information from Record Keeping GAAMPs can be inputs to irrigation scheduling
Irrigation Scheduling Components • Plant Growth and Water Use • Soil Water Holding Capacity • Rainfall / Irrigation • RECORDKEEPING
Plant Growth and Water Use Fundamentally crops use water to facilitate cell growth, maintain turgor pressure, and for cooling. Crop water use is driven by the evaporative demand of the atmosphere. Optimum crop growth and health occurs when the soil moisture content is held between 50 – 80% of the “plant available water”
Irrigation Scheduling -- Primary Factors (Irrigation GAAMPs) • Know available soil water for each unit depth of soil • Know depth of rooting for each crop • Know allowable soil moisture depletion at each stage of plant growth • Use evapotranspiration data to estimate crop water use • Measure rainfall in each field • Know water retention and container capacity (volume) used for nursery crops
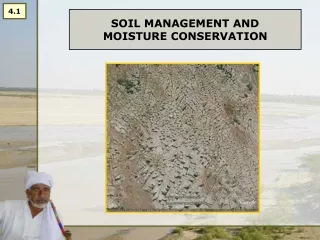
Available Soil Water • Soil absorbs and holds water in much the same way as a sponge. • A given texture and volume of soil will hold a given amount of moisture. • The intake rate of the soil will influence the rate at which water can be applied. • The ability of soil to hold moisture, and amount of moisture it can hold, will greatly affect the irrigation operational schedule
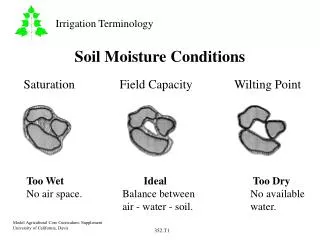
Soil Moisture • Hygroscopic water is moisture that is held too tightly in the soil to be used by plants. • Capillary water is moisture that is held in the pore spaces of the soil and can be used by plants. • Gravitational water drains rapidly from the soil and is not readily available to be used by plants.
Soil moisture • The permanent wilting point represents the boundary between capillary water and hygroscopic water. • Because hygroscopic water is not usable by plants, continuous soil moisture levels below the permanent wilting point will result in damage to or death of the plants. • Field capacity represents the boundary between gravitational water and capillary water. It is the upper limit for soil moisture that is usable by plants.
1) Note that wilting coefficient increases as texture becomes finer. 2) Field capacity θv increases as texture becomes finer until silt loams, then levels off. 3) Greatest plant-available H2O capacity (PAWC) occurs with medium- rather than fine-textured soils. Figure 5.25 General relationship between soil water characteristics and soil texture. Remember these are representative curves & individual soils will likely have values different from those shown. (Brady and Weil, 2004, p. 157)
Percent Sand Importance of surface area/mass is shown by the fact that it takes: >85% sand to be a sand soil >80% silt to be a silt soil, but only ~40% clay to be a clay soil Generally, the best soils for arable crops are those that contain: 10-20% clay 3% organic matter equal % of sand & silt 100% 10 90 20 80 30 70 Clay (C) 40 60 Percent Silt Percent Clay 50 50 Silty Clay (SIC) Sandy Clay (SC) 60 40 Silty Clay Loam (SICL) Clay Loam (CL) 70 30 Sandy Clay Loam (SCL) 80 Loam (L) 20 Sandy Loam (SL) Silt Loam (SIL) 90 10 Silt (SI) Loamy Sand (LS) Sand (S) 100% 10 20 90 80 70 60 50 40 30 100% Figure 3.2 The textural triangle used to classify soil. (Scott, 2000, p. 39)
Plant Water Needs • The amount of water a plant requires includes the water lost by evaporation into the atmosphere from the soil and the transpiration, which is the amount of water used by the plant. • The combination of these is evapotranspiration (ET).
Reference Evapotranspiration • ETo, or potential evapotanspiration, represents a well watered, fully developed plant such as grass • Reference evapotranspiration is multiplied by a crop coefficient to obtain the ET rate for a specific crop • The crop coefficient varies throughout the growing season
Estimates of ET • “Max” and “min” temperatures • Relative humidity • Wind • Net radiation • Modified Penman to estimate ETo • Enviro-weather www.enviroweather.msu.edu/
For Annual Crops • Depth of root zone increases during the growing season • Allowable soil moisture depletion varies with each stage of plant growth
Depth of Rooting Ref. Vitosh, Irrigation Guide, CES, MSU
Rainfall Measurement • Measure in each field • Should be read each day that a rain event occurs • Record the time when the reading is taken – should be consistent • Keep Clean • Install away from obstructions • Basic gauges must not be allowed to freeze • http://www.enviro-weather.msu.edu/
Rain Gauges • Basic unit – 2 inch opening • Cost -- less than $10.00 ea • 1-800-647-5368 • http://www.forestry-suppliers.com/product_pages/view_catalog_page.asp?id=5479
Estimating ET for Different Crops • Combining a “Crop Coefficient Curve” with the reference ET. • Crop Curve is a relationship between the specific plants’ growth characteristics and its water use relationship to the reference crop.
Minnesota Data Michigan Data
Relative diameters of a 0.002 mm clay particle, a 0.02 mm silt particle, and a 0.15 mm fine sand grain enlarged 1000 times. Slide from Lee Jacobs
1) Note that wilting coefficient increases as texture becomes finer. 2) Field capacity θv increases as texture becomes finer until silt loams, then levels off. 3) Greatest plant-available H2O capacity (PAWC) occurs with medium- rather than fine-textured soils. Figure 5.25 General relationship between soil water characteristics and soil texture. Remember these are representative curves & individual soils will likely have values different from those shown. (Brady and Weil, 2004, p. 157)
Resistance Slide from Ron Goldy
Tensiometers and Watermarks http://www.specmeters.com/Soil_Moisture/
Time Domain Reflectometry Time domain reflectometry. The speed of an electromagnetic signal passing through a material varies with the dielectric of the material. http://www.campbellsci.com.au/hydrosense
John Deere Connect 2013 – Sandy Loam - Sum Frequency Domain Reflectometry (FDR)