Download
1 / 23
240 likes | 274 Views
Comparative Payback of Lithium-Ion Batteries for Pacific NW Ferries. December 16, 2016. Presented by Will Ayers, P.E. Chief Electrical Engineer Elliott Bay Design Group. Introduction. Advantages of lithium-ion batteries for marine applications High energy density High power d ensity

E N D
Comparative Payback of Lithium-Ion Batteries for Pacific NW Ferries December 16, 2016 Presented by Will Ayers, P.E. Chief Electrical Engineer Elliott Bay Design Group
Introduction • Advantages of lithium-ion batteries for marine applications • High energy density • High power density • High cycle life • Redundancy = safety • Increased efficiency • Optimized load on diesel engines • Excels with highly variable loads, dynamic positioning (DP) • Reduced emissions • Increased compliance within an Emission Control Area (ECA) • Reduced carbon emissions taxes or • Increased carbon emissions credits • Compatibility with solar or wind
The Northwest Advantage • Electricity rates at 6 cents/kWh • Diesel has averaged ~$2.50/gal the last 10 years • Electricity from diesel costs 18 cents/kWh. Operating expenses raise this to 20 cents/kWh. • If a lithium-ion battery costs $1000/kWh and supplies 10,000 cycles, it costs ~10 cents/kWh per cycle to store energy. • This 10 cents/kWh-cycle would undercut the 14 cents/kWh-cycle difference offered by the grid. • At this point, payback becomes rapid and easy to accomplish. 20¢/kWh-c -6¢/kWh-c $1000/kWh = 10¢/kWh-c 10000 cycles 14¢/kWh-c
Cycle Life and Depth of Discharge (DOD) • Figure C.1, Annex C of IEEE Standard 1679 6900 2500 100
Cycle Life and Depth of Discharge (DOD) • Template for lithium titanium oxide & 20000 cycles 55200 20000 6900 2500 50 100
Effective Cost vs Effective Life Cycle Cost • Effective Cost • Downside to reducing depth of discharge (DOD) = 2 kWh 1 kWh $2,000 $1,000
Effective Cost vs Effective Life Cycle Cost • Effective Life Cycle Cost • Upsides to reducing depth of discharge (DOD) = $1,000 $2,000 2500 cycles 40¢/kWh-c 6900 cycles 29¢/kWh-c
Assumptions • New diesel electric vessel vs. battery powered vessel • Similar to large WSF vessel • Low weight impact from batteries • Battery bank needs: • 2000kWh to make a one-way crossing • Full recharge after each crossing • 18 charge/discharge cycles per day • At 100% DOD, need four 500kWh racks in four battery rooms • The battery room structural costs of this new vessel will be offset by savings in other structural costs such as engine room spaces. • Diesel generators will be retained as spinning reserve. • Not included as a cost differential.
Vessel and Shore-side Costs and DOD • Costs Scaled with Reducing DOD: • Battery total capital cost • Greater space needed to store batteries • Support system costs go up: • Air or water cooling systems start at $50,000/room • Fire suppression start at $50,000/room • Fixed Costs: • Shore power charging to cost $1,000,000 • Costs determined by the time frame and kilowatt (kW) throughput • At 20 minutes, a 6000kW charging system is needed.
Vessel and Shore-side Costs and DOD • Increasing costs will put pressure on solutions that try to lower DOD too far to achieve payback.
Payback Calculations Three quantities. • Life in years for the onboard battery bank. Life of the system > Payback period • Gross savings per kWh per year /kWh-yr ≈ $1.8 million/year for entire battery bank • Payback period (discount rate of 5%)
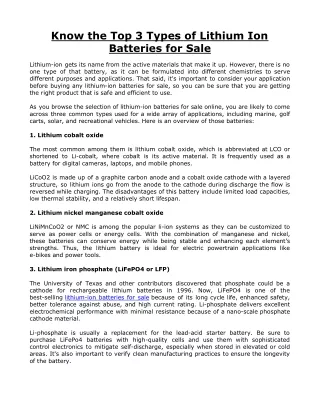
Payback of Three Lithium-ion Chemistries • Lithium iron phosphate (LFP) • Lithium nickel manganese cobalt oxide (NMC) • Lithium titanium oxide (LTO) • LFP • Lowest cycle life = 3000 cycles • Least expensive = $700/kWh • LFP is often thought of as the safest • NMC • Higher cycle life = 8000 cycles • Cost = $900/kWh • Highest energy density • LTO • Highest cycle life = 20000 • Highest cost = $1500/kWh • Least energy dense
LFP Results • Payback achieved but drops DOD down to 25% • At 25% DOD, cycle life at 41,600, 10¢/kWh-cycle • Six years to payback (where the red battery life curve crosses the blue payback curve) • The 25% DOD would lead to a 8,000kWh battery bank
NMC Results • Impressive payback at 45% DOD • At 45% DOD, cycle life at 27,000, 10¢/kWh-cycle • Three and a half years to payback • The 45% DOD leads to a 4,400kWh battery bank. NMC’s energy density means a smaller bank vs LFP or LTO at the same size
LTO Results • Impressive payback at 80% DOD • At 80% DOD, cycle life at 24,000, 11¢/kWh-cycle • Payback in just over three years, the fastest of the three • The 80% DOD would lead to a 2,500kWh battery bank
Financial Dividends • Battery pack replacements: • Fairly frequent • The first pack pays off the shore power charging system • Subsequent battery pack replacements achieve significant savings • Example LTO system at 80% DOD after initial payback • Operating another 30 years replacing batteries every 3 years • Saves $590,000/year • Total of $17.7 million.
The True Challenge: Shore Charging • Assuming a full charge in 20 minutes to meet schedule, the shore power charging system would need to supply 6000kW: • 833A at 4160V 3ph or • 317A at 11kV 3ph • Very significant level of power • Too dangerous for direct interaction by vessel crew. • Limited turnaround requires automated connection • Until recently, no available solutions
Initial Advances • Siemens, Cavotec, and CorvusEnergy: • Technical leap with the car ferry the Ampere in Norway • Two different forms of shore power charging • No direct involvement of the crew • Quick and safe connections • But, not capable of charge rates for our application
More Significant Advances on the Horizon ABB and Plan B Energy Storage (PBES): • Two new ScandlinesHelsingborg-Helsingörferries • 4.16MWh of onboard batteries • In service by late 2017 • An ABB robot makes the medium voltage shore power connections • 10kV, 1200kWh in up to 5.5 minutes, 10MW rate. Image courtesy Jan-Erik Räsänen, ABB Marine Finland
More Significant Advances on the Horizon Wartsila and Cavotec: • Magnetic resonance coupling concept • No connection required • High frequency AC • Inductive charging across short air gap • two transformer coils, on shore and on vessel • Also will allow high rate medium voltage charging
In Summation • The current state of lithium-ion battery technology can achieve a watershed event in the marine world. • Increased safety, energy capacity, and cycle life is provided at reduced cost. • Replacing diesel electricity with battery-stored shore power yields rapid payback. • The lone remaining challenge will soon fall by the wayside, that being the limitation of shore power charging systems. • The ferry fleets and other short-haul vessel applications in the region of the Pacific Northwest should be actively pursued for widespread electrification of propulsion.
Questions/Comments? For additional information: Will Ayers, 206-204-1344 (Seattle Office) Email: wayers@ebdg.com Website: http://www.ebdg.com