Download
1 / 42
440 likes | 606 Views
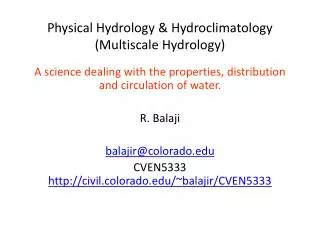
Physical Hydrology & Hydroclimatology ( Multiscale Hydrology). A science dealing with the properties, distribution and circulation of water. R. Balaji balajir@colorado.edu CVEN5333 http://civil.colorado.edu/~balajir/CVEN5333. Lectures 8-9. Water Vapor in Atmosphere Basics

E N D
Physical Hydrology & Hydroclimatology(Multiscale Hydrology) A science dealing with the properties, distribution and circulation of water. R. Balaji balajir@colorado.edu CVEN5333 http://civil.colorado.edu/~balajir/CVEN5333
Lectures 8-9 • Water Vapor in Atmosphere • Basics • Vertical Gradients in Atmosphere • Temperature • Pressure • Atmospheric Stability • Precipitation • Formation • Areal estimation Physical Hydrology, Dingman (Chapter 3, Appendix E) Terrestrial Hydrometeorology, Shuttleworth, (Chapter 2,3) Hydrology, Bras (Chapter 3)
Physical properties of moisture in the air Dingman 2002, Appendix D (D.2, D.3, D.5)
: How much water can the air hold? Saturation vapor pressure es(t). The maximum vapor pressure that is thermodynamically stable. mb, for T in oC See Goff-Gratch (1946) for more precise equation or Lowe (1977) for polynomials for efficient evaluation es(Ta) ea Td Relative humidity. Vapor pressure relative to saturation vapor pressure. (usually expressed as %) Ta Dew point. Td. The temperature to which a parcel of air has to be cooled at constant (vapor) pressure to reach saturation
Virtual Temperature Also with This suggests The temperature that dry air should have in order to have the same density as moist air with given q, T, p (Brutsaert, 2005, p25)
Formation of Precipitation Source of moisture Lifting mechanism (orographic or heating) Phase change from vapor to water - Energy Small nuclei or dust for droplet formation Droplets must grow as they fall to earth From Bedient
Lifting Mechanisms From Bedient
Ralph, F. M., P. J. Neiman, G. A. Wick, S. I. Gutman, M. D. Dettinger, D. R. Cayan, and A. B. White (2006), Flooding on California's Russian River: Role of atmospheric rivers, Geophys. Res. Lett., 33, L13801, doi:10.1029/2006GL026689.
Hydrostatic Atmosphere dM = Adz F dF=dM g A dz dP = dF/A = gdz F+dF
ATMOSPHERIC STABILITY Dry Adiabatic Lapse Rate (10 0C/km) Environmental Lapse Rate Altitude Moist Adiabatic Lapse Rate (6 0C/km). Lower due to release of latent heat of condensation from moist air Temp Modified from Bedient
Atmospheric Stability Stable Unstable Ambient lapse rate < adiabatic lapse rate of lifted parcel Ambient lapse rate > adiabatic lapse rate of lifted parcel From Brutsaert, 2005
Major Thunderstorm From Bedient
Hurricane Katrina in the Gulf - 8/29/2005 From Bedient Katrina 08-28-2005 at 17:00 UTC
Measuring Rainfall - Tipping Bucket • Recording gage • Collector and Funnel • Bucket and Recorder • Accurate to .01 ft • Telemetry- computer From Bedient
The Hyetograph • Graph of Rainfall Rate (in/hr) vs Time (hr) at a single gage location • Usually plotted as a bar chart of gross RF • Net Rainfall is found by subtracting infiltration • Integration of Net Rainfall over time = Direct RO Vol (DRO) in inches over a Watershed From Bedient
Mass Curves & Rainfall Hyetographs From Bedient
From Bedient Rainfall Averaging Methods
Thiessen Polygons - Areal Average Rainfall from Gages • Connect gages with lines • Form triangles as shown • Create perpendicular bisectors of the triangles • Each polygon is formed by lines and WS boundary P = S (Ai*Pi) / AT From Bedient
RADAR Rainfall Estimates • NEXRAD provides real-time data on a ~16 km2 (6 mi2) grid • Each estimate represents an average rainfall amount over the entire 4 x 4 km2 area • NEXRAD rainfall estimates compare well with point rain gage measurements (r2 ~ 0.9) From Bedient