Download
1 / 55
550 likes | 651 Views
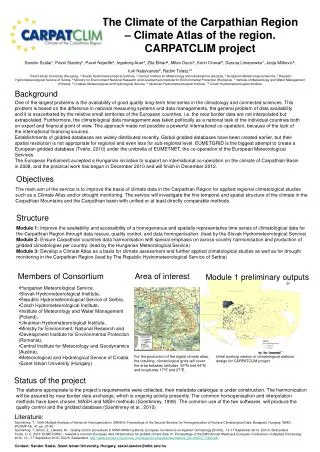
Climate of the Calera Aquifer Region. Considerations for scenario selection. Calera Aquifer Watershed. Fresnillo. Calera. Santa Rosa. Zacatecas. 2024 km 2. Stations with precipitation and temperature data for 1950-2008. 800. 700. 600. 500. 400. 300. 200. 100. 1950. 1960.

E N D
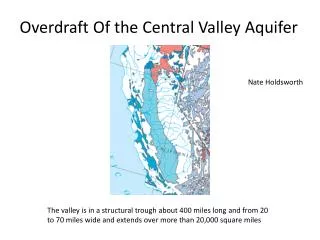
Climate of the Calera Aquifer Region Considerations for scenario selection
Calera Aquifer Watershed Fresnillo Calera Santa Rosa Zacatecas 2024 km2 Stations with precipitation and temperature data for1950-2008
800 700 600 500 400 300 200 100 1950 1960 1970 1980 1990 2000 2010 Mean Annual Precipitation Calera Aquifer Watershed, Mexico Fresnillo (2240 m) Santa Rosa (2195 m) Calera (2192 m) Mean: 454 mm Temperature [Deg. C] Mean: 428 mm Mean: 424 mm R2~0.6
Calera Aquifer Watershed Fresnillo 20.4 km Calera Santa Rosa 14.4 km 41.4 km Zacatecas 1950-2008 regional precipitation Calera Aquifer region, Mexico
700 600 500 400 300 200 1950 1960 1970 1980 1990 2000 2010 Annual Precipitation Calera Aquifer Watershed, Mexico Mean: 430 [mm] 25th Percentile Precipitation [mm/yr] 75th Percentile 1950-2008
Annual Precipitation Trends Calera Aquifer Watershed, Mexico Long-Term Trends vs Variations
700 600 500 400 300 200 1950 1960 1970 1980 1990 2000 2010 Annual Precipitationand Linear Trend Calera Aquifer Watershed, Mexico 1950-2008 58-year trend Linear regression Precipitation [mm/yr] t-test, p-value: 0.39 => no trend
700 Annual P 5-yr MA 650 600 550 500 450 400 350 300 Above average 250 Below average 200 1950 1960 1970 1980 1990 2000 2010 Annual Precipitation and Persistent Variations Calera Aquifer Watershed, Mexico 1950-2008 Precipitation [mm/yr] 6 yrs 4 yrs 5 yrs
Seasonal Precipitation Trends Calera Aquifer Watershed, Mexico - Wet season - Dry season - Irrigation season
100 80 60 40 20 0 Dec Jan Feb Mar Apr May Jun Jul Aug Sep Oct Nov Mean Monthly Precipitation and Irrigation Activity Calera Aquifer Watershed, Mexico Summer crops Irrigation Wet season Seeding summer crops Precipitation [mm/mn] Dry season 75% of annual precipitation Dry season
600 500 400 300 200 100 1950 1960 1970 1980 1990 2000 2010 Wet Season Precipitation and Linear Trend Calera Aquifer Watershed, Mexico 58-year trend Linear regression Wet season (Jun - Sep) Precipitation [mm/yr] 1950-2008 t-test, p-value: 0.15 => possible trend
350 300 250 200 150 100 50 0 1950 1960 1970 1980 1990 2000 2010 Dry Season Precipitation and Linear Trend Calera Aquifer Watershed, Mexico Dry Season (Oct - May) 58-year trend Linear regression Precipitation [mm/yr] 1950-2008 t-test, p-value: 0.43 => no trend
125 100 75 50 25 0 1950 1960 1970 1980 1990 2000 2010 Mar - May Precipitation and Linear Trend Calera Aquifer Watershed, Mexico Irrigation Season March - May 1950-2008 58-year trend Linear regression t-test, p-value: 0.48 => no trend Precipitation [mm]
Monthly Precipitation Trends Calera Aquifer Watershed, Mexico
Mean Monthly Precipitation Calera Aquifer Watershed, Mexico 110 1950-1974 (25 yrs) 100 1984-2008 (25 yrs) 1975-2008 (34 yrs) 90 80 70 60 Precipitation [mm/mn] 50 40 30 20 10 0 Jan Feb Mar Apr May Jun Jul Aug Sep Oct Nov Dec
Mean Monthly Precipitation Calera Aquifer Watershed, Mexico 110 1950-1974 (25 yrs) 100 1984-2008 (25 yrs) 1975-2008 (34 yrs) 90 80 70 60 Precipitation [mm/mn] 50 40 30 20 10 0 Jan Feb Mar Apr May Jun Jul Aug Sep Oct Nov Dec July 25 mm +25% June 10 mm +15% April 6 mm -50%
70 60 April P 5-yr MA 50 40 30 20 10 Above average Below average 0 1950 1960 1970 1980 1990 2000 2010 April Precipitation and Persistent Variations Calera Aquifer Watershed, Mexico April Climate Shift ? Precipitation [mm] (Trend ?)
200 180 June P 5-yr MA 160 140 120 100 80 60 40 Above average 20 Below average 0 1950 1960 1970 1980 1990 2000 2010 June Precipitation and Persistent Variations Calera Aquifer Watershed, Mexico June Climate Shift ? Precipitation [mm]
300 July P 5-yr MA 250 200 150 100 50 Above average Below average 0 1950 1960 1970 1980 1990 2000 2010 July Precipitation and Persistent Variations Calera Aquifer Watershed, Mexico July Climate Shift ? Precipitation [mm]
Mean Monthly Precipitation Calera Aquifer Watershed, Mexico 1950-1969 (20 yrs) 100 1970-2008 (39 yrs) 80 60 Precipitation [mm/mn] 40 20 0 Jan Feb Mar Apr May Jun Jul Aug Sep Oct Nov Dec More rain during wet season 25 mm +30% 20 mm +30% Drier during early irrigation season 10 mm -50%
Summary - There appears to be no conclusive evidence of gradual trends in the observed annual, seasonal and/or monthly precipitation. - In the late 1960s – early 1970s, a distinct shift to higher monthly precipitation values was observed for the months of June and July. At the same time a shift to lower monthly precipitation values was observed for the month of April.
Recommendation - Precipitation characteristics for scenarios under current climate conditions are best represented by the 1970-2008 precipitation record. - Persistent and pronounced multi-year dry and wet spells may represent important scenarios for economic, production and water demand considerations.
CLIMATE Scenario A1b “Middle of the road scenario” 5 North American GCM
31-yr MA of North American GCM Annual Precipitation Torreon Region, Mexico 400 Scenario A1b (1950-2099): “Middle emissions path" 375 5 North American GCM models. 350 325 300 275 Precipitation [mm/yr] 250 225 Canadian Centre for Climate Modeling and Analysis U.S. Dept. of Com./NOAA/Geophysical Fluid Dynamics Lab V2.0 U.S. Dept. of Com./NOAA/Geophysical Fluid Dynamics Lab V2.1 NASA/Goddard Instit. for Space Studies National Center for Atmospheric Research-CCSM 200 175 150 125 1950 1970 1990 2010 2030 2050 2070 2090
400 380 360 340 320 300 280 260 240 Above average 220 Below average 200 1950 1970 1990 2010 2030 2050 2070 2090 Projected Annual Precipitation and Persistent Variations Torreon Region, Mexico Scenario A1b: “Middle emissions path" 5 North American GCM models. Precipitation [mm/yr] 1950-2099
400 380 360 340 320 300 280 260 240 220 200 1950 1970 1990 2010 2030 2050 2070 2090 Projected Annual Precipitation and Linear Trend Torreon Region, Mexico Scenario A1b: “Middle emissions path" Linear regression 5 North American GCM models. Precipitation [mm/yr] 1950-2099 t-test, p-value: 0.06 => trend
400 380 360 340 320 300 280 260 240 220 200 1950 1970 1990 2010 2030 2050 2070 2090 Projected Annual Precipitation and Trend in Mean Torreon Region, Mexico Scenario A1b (1950-2099): “Middle emissions path" 5 North American GCM models. +5% +6% Precipitation [mm/yr] -5% -5% Mean P: 287 mm/yr
Scenario A1b (1950-2099): “Middle emissions path" 290 Jun to Sep 5 North American GCM models. 270 t-test, p-value < 0.0001 => trend 250 Precipitation [mm/season] 230 210 190 160 170 140 150 120 100 Precipitation [mm/season] 80 60 Oct to May t-test, p-value: < 0.0001 => trend 40 1950 1970 1990 2010 2030 2050 2070 2090 GCM Projected Seasonal Precipitation and Linear Trend Torreon Region, Mexico
Projected Mean Monthly Precipitation Torreon Region, Mexico 70 Scenario A1b: “Middle emissions path" 5 North American GCM models. 60 1970-2008 2009-2040 50 2041-2099 Irrigation season 40 Precipitation [mm/mn] 30 Wet season 20 10 0 Jan Feb Mar Apr May Jun Jul Aug Sep Oct Nov Dec Month
Summary - The GCM precipitation projections for the Torreon region support the observation that the wet season is getting wetter and the dry season has a tendency towards getting drier. - However, the shift in observed monthly precipitation for June and July is not reproduced by the GCM data of the Torreon region.
Recommendation - If climate change scenarios are to be considered, only subjective precipitation projections can be made based on GCM data of the Torreon region, Mexico. Option: the 1970-2008 monthly precipitation in the Calera Aquifer watershed is change proportionally to the change projected by the GCM data for the Torreon region over the same time period.
Annual Air Temperature Calera Aquifer Watershed, Mexico
Calera Aquifer Watershed Fresnillo 20.4 km Calera Santa Rosa 14.4 km 41.4 km Zacatecas 1950-2008 regional temperature Calera Aquifer region, Mexico
18.5 18 17.5 17 16.5 16 15.5 15 14.5 14 13.5 13 1950 1960 1970 1980 1990 2000 2010 Mean Annual Temperature Calera Aquifer Watershed, Mexico Calera (2192 m) Mean: 16.4 C Fresnillo (2240 m) Santa Rosa (2195 m) Temperature [Deg. C] Mean: 15.5 C Mean: 14.8 C R2 ~ 0.1 - 0.3
17 16.5 16 15.5 15 14.5 14 1950 1960 1970 1980 1990 2000 2010 Mean Annual Temperature and Linear Trend Calera Aquifer Watershed, Mexico 58-year trend Linear regression Temperature [Deg. C] 1950-2008 t-test, p-value: 0.28 => no trend
Mean Annual Temperature and Persistent Variations Calera Aquifer Watershed, Mexico 17 16.5 16 Temperature [Deg. C] 15.5 15 14.5 Above average Below average 14 1950 1960 1970 1980 1990 2000 2010 Annual Temperature Annual P 5-yr MA 10 yrs 1950-2008
20.5 19.5 18.5 15.5 17.5 14.5 13.5 12.5 2010 1950 1960 1970 1980 1990 2000 Seasonal Temperature and Linear Trend Calera Aquifer Watershed, Mexico t-test, p-value: 0.97 => no trend Wet season Jun to Sep Linear regression Temperature [Deg. C] Dry season Oct to May Temperature [Deg. C] Linear regression t-test, p-value: 0.13 => possible trend
21 1950-1974 1984-2008 19 17 15 13 11 9 Jan Feb Mar Apr May Jun Jul Aug Sep Oct Nov Dec Mean Monthly Temperature Calera Aquifer Watershed, Mexico Precipitation [mm/mn] Warming ~ +0.5 deg. C
December-February Temperature and Persistent Variations Calera Aquifer Watershed, Mexico 13.5 13 12.5 12 Temperature [Deg. C] 11.5 11 10.5 10 Above average Below average 9.5 1950 1960 1970 1980 1990 2000 2010 Dec - Jan - Feb Climate Shift ? Trend? 1950-2008
13.5 13 12.5 12 11.5 11 10.5 10 9.5 1950 1960 1970 1980 1990 2000 2010 December-February Temperature and Linear Regression Calera Aquifer Watershed, Mexico Dec - Jan - Feb 58 year trend Linear regression Temperature [Deg. C] 1950-2008 t-test, p-value: 0.003 => trend
23 22 21 20 19 18 17 5 4 3 2 1 0 1950 1960 1970 1980 1990 2000 2010 Seasonal Temperature and Linear Trend Calera Aquifer Watershed, Mexico t-test, p-value: 0.06 => trend Dec-Feb TMAX Linear regression Temperature [Deg. C] Dec-Feb TMIN Linear regression Temperature [Deg. C] t-test, p-value: 0.01 => trend
21.5 21 20.5 20 19.5 19 18.5 18 17.5 1950 1960 1970 1980 1990 2000 2010 May-July Temperature and Linear Trend Calera Aquifer Watershed, Mexico May – June – July 58 year trend Linear regression Temperature [Deg. C] 1950-2008 t-test, p-value: 0.17 => possible trend
Summary - There is no evidence of a relevant trend in observed mean annual air temperature. - No relevant temperature trend was detected in the wet or dry season. - A warming trend of ~ 2.1 deg. C per century was observed for the months of December, January and February.
27 26 25 24 23 22 21 20 19 1950 1970 1990 2010 2030 2050 2070 2090 GCM Projected Mean Annual Temperature Torreon Region, Mexico Scenario A1b: “Middle emissions path" 5 North American GCM models. 31-year moving average. Temperature [Deg. C] 1950 reference line 1950-2099
25 24.5 24 23.5 23 22.5 22 21.5 21 20.5 20 1950 1970 1990 2010 2030 2050 2070 2090 Projected Mean Annual Temperature Torreon Region, Mexico Scenario A1b: “Middle emissions path" 5 North American GCM models. 2050 Temperature [Deg. C] 2030 Mean Annual ! 2008 1950-2099 1950
30 29 28 23 27 22 26 21 25 20 19 18 17 1950 1970 1990 2010 2030 2050 2070 2090 Projected Seasonal Temperature and Linear Trend Torreon Region, Mexico Scenario A1b: “Middle emissions path" 5 North American GCM models. Linear regression t-test, p-value: <0.0001 => trend Jun to Sep Temperature [Deg. C] Linear regression Temperature [Deg. C] t-test, p-value: <0.0001 => trend 1950-2099 Oct to May